GE shortBig gap downwards breaking through support area on huge volume at 9.00$/share.
Take short position at level 8.80-9.10$ with target at 7.30$.
Stop-loss at 9.30$
GCP trade ideas

Don't let GE's accountancy issues ruin your trading account. We definitely will not be bottom fishing in GE, this saga has just started and regardless of who is right about the allegations, Wall Street does not benefit. Seeing a representative of a undisclosed short seller appear on TV and accuse the Company of extreme malpractices seems criminal to me. On the other hand is GE have actually done what the accused of the ramifications will be horrendous.

GE broke down from 10 dollars. Possible buying opportunity?GE has been in a big down trend since 2000! where it reached around the seventy dollar area. Now it's going back down after several months in the 10 dollar area. The next levels to watch are around 6.50 where it could be a possible great buy even with all the negative factors. It is none the less a well known brand and there is something to be said for that fundamentally speaking. I'll be keeping an eye on this one over the next few weeks.
Possible 100%+ return! (Not trading or investment advice.)

General Electric - Expect volatilityGE, America's sweetheart has been accused of fraud allegations before. This time though, it's by the same person who did it on the Madoff Scheme (Harry Markopolos)
Markopolos’ main points of contention are:
1) GE’s insurance obligations are woefully under-reserved and it has been lying to the Kansas Insurance Department
2) GE shouldn’t have consolidated BHGE’s financial statements, which are a source of confusion
3) GE’s evolving presentation makes it very difficult to evaluate GE’s operating performance.
-------
In response to the whole ordeal, General Electric's CEO bought $2million in shares.


GE - Reminder of The TrendReminding viewers of what we posted 17 months ago! Lots of research being published today. The simple version is to remember Basel III agreement TCE ratios. That being addressed, GE will need capital.
How that does it remains to be seen.
GE needs a minimum of $32.25 billion adding non controlling equity back to the balance sheet. A maximum of $52.56 billion taking out non controlling equity.
This equates to a negative $5-$10 per share currently.
2019 Cash Flow is estimated to be ~$8.812 billion. At no growth this produces an intrinsic value of $6.14 - $14.13 per share.


GE formed bullish shark a good long opportunityPriceline of GENERAL ELECTRIC CO (GE) Stocks has completed a bullish shark pattern and entered in potential reversal zone.
From here price aciton will take bullish divergence soon insha Allah.
I have defined targets using Fibonacci sequence as below:
Buy between: 9.33 to 8.94
Sell between: 9.67 to 10.42
Regards,
Atif Akbar (moon333)

GE Bullish CallsShowing positions i placed yesterday and today.
Long calls with 09 August expiry
entered 9.5 strike with .30 and .18 cost per contract
9.80 price target


Possible 3rd Quarter Break Out for GEI was looking at this trying to determine a downward trend for GE but based upon the RSI and MA I am more optimistic that there may be an upward tick coming. I would suggest watching this for the next few weeks as it test the support / resistance barriers. Earning were nothing special but RSI suggest there may be a slight undervaluation here.

$GE Reversed off .5 Fib, Falling Wedge. (Earnings Tomorrow)Please see callouts on chart. Trade with caution, as earnings release tomorrow may invalidate this setup.
If key resistance is broken, I expect movement at least to $10.90
Goodluck!


General Electric (GE) Long-TermClear triangle pattern forming before eventual breakdown to continue GE's gradual fall
NYSE:GE

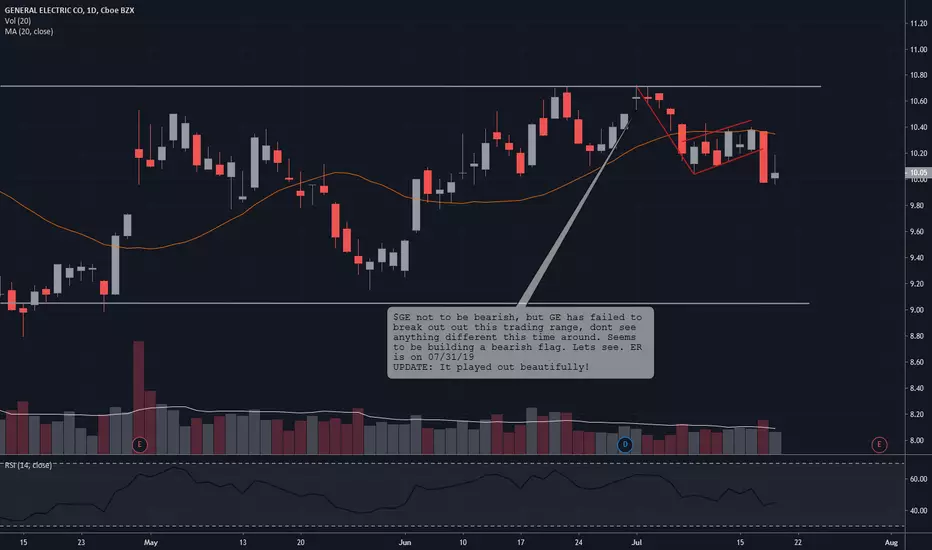
$GE bearish flagI dont have to much confidence in $GE , looks to be forming a bearish flag, lets see if it comes to fruition.

Daily GE stock price trend forecasts analysis 15-JUL
Investing position: In Falling section of high risk & low profit so far. But it would be in rising section tomorrow
S&D strength Trend: In the midst of a rebounding trend of upward direction box pattern price flow marked by limited falls and upward fluctuations.
Today's S&D strength Flow: Supply-Demand strength has changed to a strengthening selling flow when stock market opening.
read more: www.pretiming.com
Forecast D+1 Candlestick Color : GREEN Candlestick
%D+1 Range forecast: -0.1% (HIGH) ~ -0.8% (LOW), -0.2% (CLOSE)
%AVG in case of rising: 2.3% (HIGH) ~ -1.0% (LOW), 1.3% (CLOSE)
%AVG in case of falling: 1.0% (HIGH) ~ -2.5% (LOW), -1.7% (CLOSE)

GE moving up into Q2 earningsWatching for this to continue moving up. Must break resistance levels near 10.51 and 10.7

Long GE if it can break resistanceBeen trading sideways - but if it can break resistance lines 1 and 2 I see upside potential. moving averages above trend just needs a breakout.


pin bar daily candle @ 200 day EMA pretty simple set up ill be looking for a break above 10.57 to go long, if the scenario ends up a bearish one ill look for a break of that pivot level to take us down to S1 or that red support for a 3rd test 9.50-9.60 area, would be a great spot to get bullish again if we test and hold that 9.50-9.60 area
