IBM Stock Forecast and Technical OutlookIBM Stock Forecast and Technical Outlook.
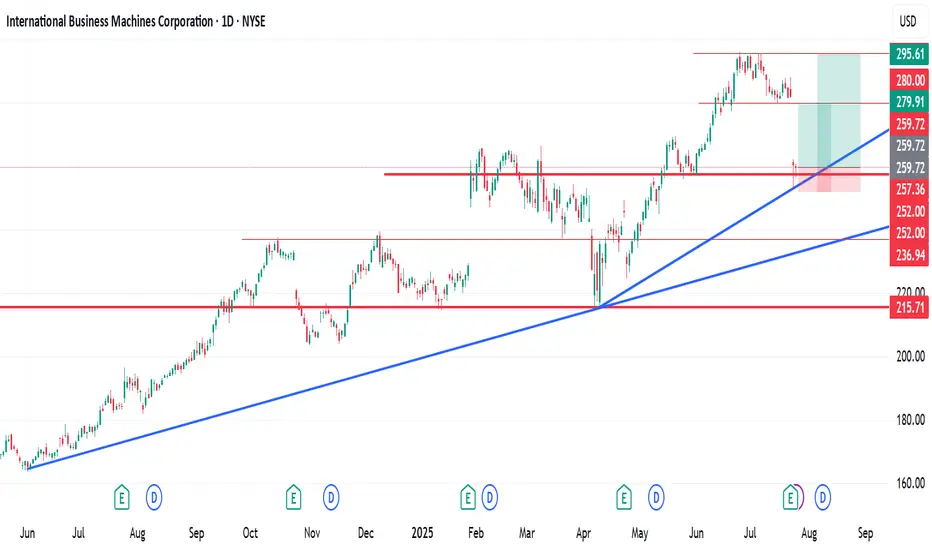
International Business Machines Corporation (IBM) reached a recent peak in June 2025 before experiencing a gradual decline. On July 24th, the stock saw a significant drop of over 10%, likely triggered by investor reaction to recent company news or broader m
Next report date
—
Report period
—
EPS estimate
—
Revenue estimate
—
5.35 EUR
5.82 B EUR
60.62 B EUR
930.54 M
About International Business Machines Corporation
Sector
Industry
CEO
Arvind Krishna
Website
Headquarters
Armonk
Founded
1911
FIGI
BBG000K23JT6
International Business Machines Corporation (IBM) is a technology company. The Company operates through five segments: Cognitive Solutions, Global Business Services (GBS), Technology Services & Cloud Platforms, Systems and Global Financing. The Cognitive Solutions segment delivers a spectrum of capabilities, from descriptive, predictive and prescriptive analytics to cognitive systems. Cognitive Solutions includes Watson, a cognitive computing platform that has the ability to interact in natural language, process big data, and learn from interactions with people and computers. The GBS segment provides clients with consulting, application management services and global process services. The Technology Services & Cloud Platforms segment provides information technology infrastructure services. The Systems segment provides clients with infrastructure technologies. The Global Financing segment includes client financing, commercial financing, and remanufacturing and remarketing.
Related stocks
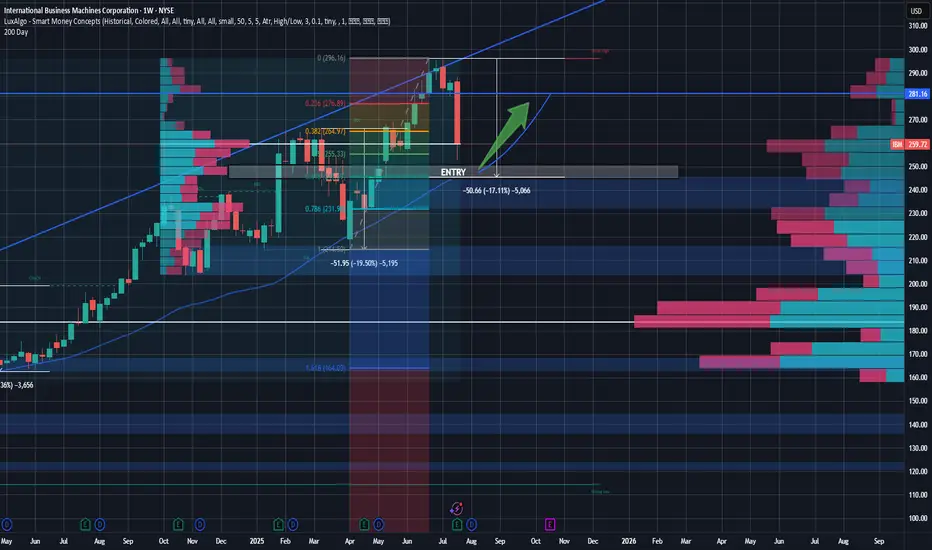
IBM Rebound Trade - Buying the Pullback at Key ConfluenceSetup:
IBM is setting up for a potential high-conviction long entry around the $245 level, a price zone marked by multiple layers of technical confluence and volume-based support. Over the last 18 months, IBM has seen two notable pullbacks—both in the 17–20% range, often around earnings events. The
Looking like an immediate buy on IBM! OptionsMastery:
🔉Sound on!🔉
📣Make sure to watch fullscreen!📣
Thank you as always for watching my videos. I hope that you learned something very educational! Please feel free to like, share, and comment on this post. Remember only risk what you are willing to lose. Trading is very risky but it can c

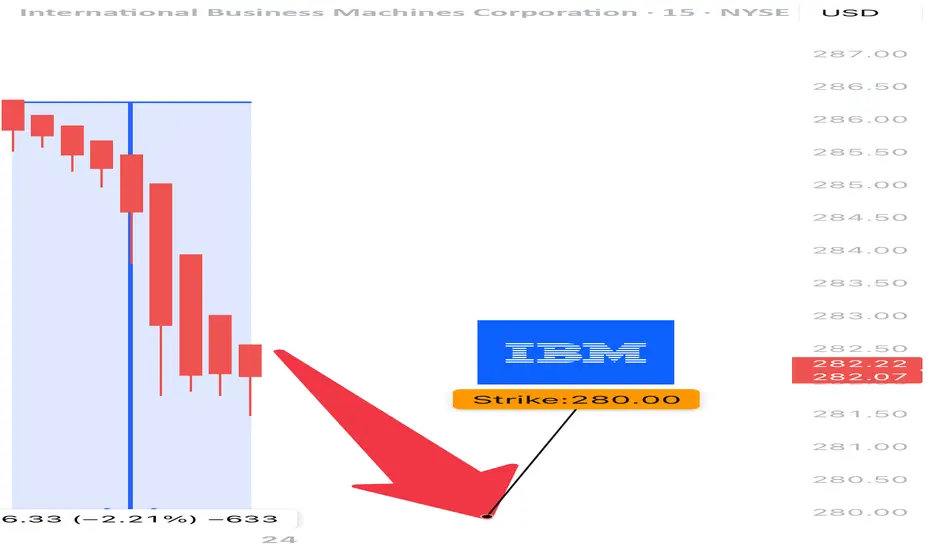
IBM Earnings Trade Setup – JULY 22, 2025
📡 IBM Earnings Trade Setup – JULY 22, 2025
💼 IBM: Big Blue’s Rebound or Breakdown? Earnings Play Incoming
⸻
🔍 1. FUNDAMENTALS SNAPSHOT
📊 Revenue Growth: +0.5% YoY — flat in a fast-moving tech landscape
💰 Margins:
• Gross: 57.0%
• Operating: 12.4%
• Net: 8.7%
⚠️ Debt-to-Equity: 247.98 – Very h

IBM Earnings Analysis Summary (2025-07-23)
🧨 IBM Earnings Trade Idea 🧨
Earnings Date: July 24, 2025 (AMC)
🧠 Confidence: 70% Bearish | 🎯 Expected Move: ~5%
⸻
🔍 Snapshot Summary:
• 🐢 Revenue Growth: Flat at +0.5% YoY
• ⚠️ High Debt: D/E ratio at 247.98 — compression risk
• ✅ Beat History: 100% past 8 quarters, but…
• 🤔 Forward EPS Proj

IBM EARNINGS TRADE IDEA — BEARISH SETUP INTO EARNINGS
⚠️ IBM EARNINGS TRADE IDEA — BEARISH SETUP INTO EARNINGS ⚠️
📅 Report Date: July 25, 2025 (AMC)
🔎 Confidence Level: 70% Bearish Bias
🧠 Thesis: Fundamentals weak | Options market hedging | Price below key MA | Guidance risk elevated
⸻
🔍 Quick Breakdown:
• IBM is lagging in growth: TTM revenue up j
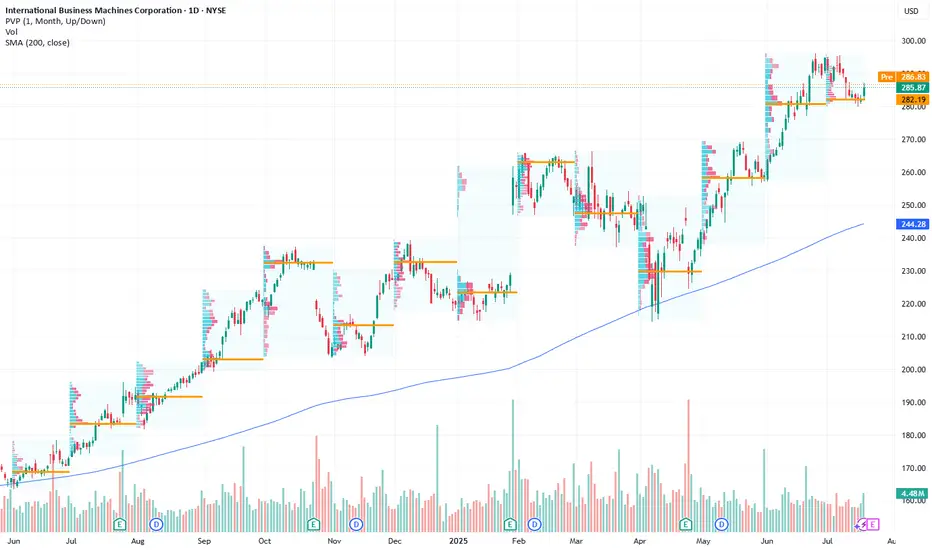
IBM's Cloud & Consulting Momentum Presents Bullish Setup Current Price: $285.87
Direction: LONG
Targets:
- T1 = $294.00
- T2 = $305.00
Stop Levels:
- S1 = $279.50
- S2 = $276.00
**Wisdom of Professional Traders:**
This analysis synthesizes insights from thousands of professional traders and market experts, leveraging collective intelligence to id
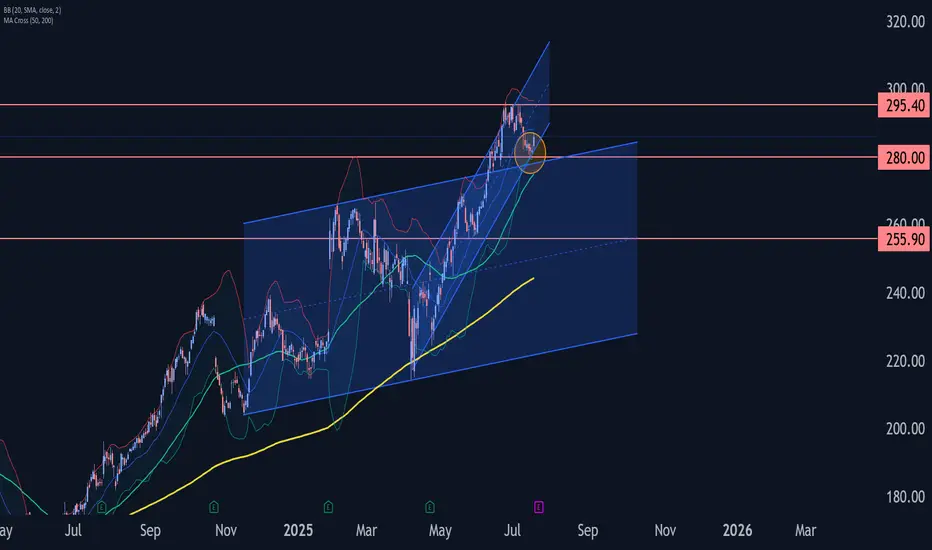
IBM Wave Analysis – 18 July 2025
- IBM reversed from support zone
- Likely to rise to resistance 295.40
IBM recently reversed up from the support zone between the support level 280.00, upper trendline of the recently broken weekly up channel from 2024 and the support trendline of the more recent up channel from April.
This suppo
IBM eyes on $282.88: Golden Genesis fib a Key Support to uptrendIBM has been in a strong uptrend but looking top-ish.
It has pulled back to a Golden Genesis fib at $282.88
Look for a bounce but perhaps after a couple orbits.
.
See "Related Publications" for previous charts like this BOTTOM CALL:
Hit the BOOST and FOLLOW for more such PRECISE and TIMELY chart

IBM: SHA-ttering ExpectationsAs we move through 2024, NYSE:IBM continues to demonstrate its strength as a technology powerhouse, particularly in cloud computing, AI, and cybersecurity. With a legacy rooted in innovation, IBM's deep history in encryption technologies and its forward-looking strategies make it a compelling buy

See all ideas
Summarizing what the indicators are suggesting.
Neutral
SellBuy
Strong sellStrong buy
Strong sellSellNeutralBuyStrong buy
Neutral
SellBuy
Strong sellStrong buy
Strong sellSellNeutralBuyStrong buy
Neutral
SellBuy
Strong sellStrong buy
Strong sellSellNeutralBuyStrong buy
An aggregate view of professional's ratings.
Neutral
SellBuy
Strong sellStrong buy
Strong sellSellNeutralBuyStrong buy
Neutral
SellBuy
Strong sellStrong buy
Strong sellSellNeutralBuyStrong buy
Neutral
SellBuy
Strong sellStrong buy
Strong sellSellNeutralBuyStrong buy
Displays a symbol's price movements over previous years to identify recurring trends.
IBM4983326
International Business Machines Corporation 2.95% 15-MAY-2050Yield to maturity
7.08%
Maturity date
May 15, 2050
IBM5354862
International Business Machines Corporation 3.43% 09-FEB-2052Yield to maturity
6.80%
Maturity date
Feb 9, 2052
IBM.GX
International Business Machines Corporation 7.0% 30-OCT-2045Yield to maturity
6.03%
Maturity date
Oct 30, 2045
IBM5449458
International Business Machines Corporation 4.9% 27-JUL-2052Yield to maturity
6.01%
Maturity date
Jul 27, 2052
IBM5534365
International Business Machines Corporation 5.1% 06-FEB-2053Yield to maturity
5.95%
Maturity date
Feb 6, 2053
I
IBM5744047
IBM International Capital Pte. Ltd. 5.3% 05-FEB-2054Yield to maturity
5.94%
Maturity date
Feb 5, 2054
See all IBM bonds
Curated watchlists where IBM is featured.


Frequently Asked Questions
The current price of IBM is 217.00 EUR — it has increased by 0.91% in the past 24 hours. Watch INTL BUS. MACH. DL-,20 stock price performance more closely on the chart.
Depending on the exchange, the stock ticker may vary. For instance, on FWB exchange INTL BUS. MACH. DL-,20 stocks are traded under the ticker IBM.
IBM stock has fallen by −2.03% compared to the previous week, the month change is a −12.07% fall, over the last year INTL BUS. MACH. DL-,20 has showed a 24.09% increase.
We've gathered analysts' opinions on INTL BUS. MACH. DL-,20 future price: according to them, IBM price has a max estimate of 302.08 EUR and a min estimate of 170.89 EUR. Watch IBM chart and read a more detailed INTL BUS. MACH. DL-,20 stock forecast: see what analysts think of INTL BUS. MACH. DL-,20 and suggest that you do with its stocks.
IBM stock is 0.90% volatile and has beta coefficient of 0.71. Track INTL BUS. MACH. DL-,20 stock price on the chart and check out the list of the most volatile stocks — is INTL BUS. MACH. DL-,20 there?
Today INTL BUS. MACH. DL-,20 has the market capitalization of 201.09 B, it has decreased by −1.34% over the last week.
Yes, you can track INTL BUS. MACH. DL-,20 financials in yearly and quarterly reports right on TradingView.
INTL BUS. MACH. DL-,20 is going to release the next earnings report on Oct 22, 2025. Keep track of upcoming events with our Earnings Calendar.
IBM earnings for the last quarter are 2.38 EUR per share, whereas the estimation was 2.25 EUR resulting in a 5.70% surprise. The estimated earnings for the next quarter are 2.10 EUR per share. See more details about INTL BUS. MACH. DL-,20 earnings.
INTL BUS. MACH. DL-,20 revenue for the last quarter amounts to 14.41 B EUR, despite the estimated figure of 14.08 B EUR. In the next quarter, revenue is expected to reach 13.89 B EUR.
IBM net income for the last quarter is 1.86 B EUR, while the quarter before that showed 975.18 M EUR of net income which accounts for 90.99% change. Track more INTL BUS. MACH. DL-,20 financial stats to get the full picture.
Yes, IBM dividends are paid quarterly. The last dividend per share was 1.49 EUR. As of today, Dividend Yield (TTM)% is 2.68%. Tracking INTL BUS. MACH. DL-,20 dividends might help you take more informed decisions.
INTL BUS. MACH. DL-,20 dividend yield was 3.03% in 2024, and payout ratio reached 103.78%. The year before the numbers were 4.05% and 81.49% correspondingly. See high-dividend stocks and find more opportunities for your portfolio.
As of Aug 4, 2025, the company has 293.4 K employees. See our rating of the largest employees — is INTL BUS. MACH. DL-,20 on this list?
EBITDA measures a company's operating performance, its growth signifies an improvement in the efficiency of a company. INTL BUS. MACH. DL-,20 EBITDA is 14.17 B EUR, and current EBITDA margin is 24.48%. See more stats in INTL BUS. MACH. DL-,20 financial statements.
Like other stocks, IBM shares are traded on stock exchanges, e.g. Nasdaq, Nyse, Euronext, and the easiest way to buy them is through an online stock broker. To do this, you need to open an account and follow a broker's procedures, then start trading. You can trade INTL BUS. MACH. DL-,20 stock right from TradingView charts — choose your broker and connect to your account.
Investing in stocks requires a comprehensive research: you should carefully study all the available data, e.g. company's financials, related news, and its technical analysis. So INTL BUS. MACH. DL-,20 technincal analysis shows the sell today, and its 1 week rating is neutral. Since market conditions are prone to changes, it's worth looking a bit further into the future — according to the 1 month rating INTL BUS. MACH. DL-,20 stock shows the buy signal. See more of INTL BUS. MACH. DL-,20 technicals for a more comprehensive analysis.
If you're still not sure, try looking for inspiration in our curated watchlists.
If you're still not sure, try looking for inspiration in our curated watchlists.