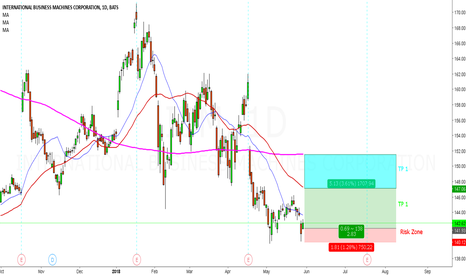
Short on IBM for 5% dipDecreasing triangle here in a downtrend. Getting a short position here around 148, looking for a dip to at least 140 (where we found a few time resistance lately). Did so with a IBM SL 165.60 HB 4.49 FN 179.07 R 10.00 BNP Paribas Turbo Short. Little margin between the most recent peaks before this triangle and the Stop Loss level.
Target is a 20/25% ROI before the end of the year.
IBM trade ideas
International Business Machines: IBM$IBM Never actually been a big fan. However the word on the street seems that they are getting back on the right track. Expecting decent earnings forecasting the next 90 days target at 168.50 if all goes well we should start seeing new trading levels around 160.00 to 170.00:
Entry: 143.30
Target: 168.50
Stop loss: 138.00
Time line: 90 days
Long Term
Looking forward to any comments or idea because we know conditions may change, also please visit cadets.cytogrp.com for more info.
IBM KNOWSIBM is very active and is investing in crypto.
Crypto is know for his volatility and people are scared about it.
If you don't like to buy crypto you can look for stocks who believe in crypto and are ready to do something with it.
Crypto is game changing and as soon as people will understand the business applications in the real life of crypto you will really see an explosion of the whole market. I'm sure about that.
If you still don't believe it but you want not to miss out a big opportunity, IBM could deserve us some satisfactions.
On the short term:
IBM is actually correcting since ATH on 2013.
A longtime trendline is not so far from here. If you see in the next month the price falling to 130 then you have to know that we are closing the last leg of a bullish bat and entering on a demand zone.
enjoy the run
BIO
This Shit is Next Level: Years from now, Because IBM has been building it's arsenal,
oh yea, Amazon, Google, ect... Blah,
IBM still has that aura about it,
+IBM just announced a debate ai, \
LOL Just what I need right, Turn it on during a dinner conversation and Peace!
Not exactly at the moment,
Their plan is to- Help with Search, !?!!%$#$#
yes, that consistent google search for item x, research opinions, think about alternatives Garbage
AI Google Buttler, AI assist me with goals, Hmmm should I go to soccer practice or should I get some much needed rest....maybe a stretch
Hmm were starting a nicknack buisness should we go with a office or outsource,
Oh great idea, and you priced up items for our team, WOW,
The early stages seem to be a web of connections driven to aid in decision making, but the future is Golden, As their Watson ; is Begining to lay dem golden eggs.
IBM has streamlined, and gone back to good old garage-nerd
And Shit will be quick in the year(s) ahead.


