KHC(W) Watch Potential SHS bottom - Stabilization 50ma BreakKHC(W) Watch Potential SHS bottom - Stabilization 50ma .618
KHNZ trade ideas

KHC - it’s about time to show some strengthBuilding up position size in Kraft Heinz TS:(KHC)
Entry: 30.40, SL: 29.50
Targets: T1- 34.83, T2- 36.50 T3- 37.90
Hold: Mid Term
Uncertainty: Medium
Roadmap for Kraft Heinz stock. Clear, sound exit opportunities when Pa hits Target level 3 for profit taking.
Investment Thesis:
1. Possible bottoming reversal pattern forming w PA upside break from downwards sloping trend line since May 2017
2. MACD crossover on the monthly
3. Stochastic crossing to the upside indicating possible buying pressure
4. Entry on current PA sets up great R/R 1:7.19, max drawdown for current trade setup is -2.79%
5. Clear 5 wave structure forming, currently completing Wave 4 of 5
Risks:
1. 1M Rsi is still in bearish territory, possible PA breaking structure and heading south
2. Stochastics could easily flip and head south negating the buying pressure as a false indicator
3. Stock has not officially set in a higher low on the monthly, but smaller TF shows a clear 5 wave structure to base the trade on
4. Stock is relatively new with little history to analyze
5. KHC is still struggling to consolidate its massive product line (most famous being Kraft Heinz Ketchup), cutting operational costs and trying to increase overall profitability


Kraft & Heinz Shows Early Signs of Price Bottoming KHC is down heavily after bouts of bad news about accounting investigation, missed earnings estimates and write downs. Recently it has a crash of around 30% in a single day upon the release of a statement disclosing several aspects of this.
Despite its mishaps, KHC is a well established company with entrenched products. These are often fairly low in cost and consumer staples and would perhaps benefit from a softer economy. The PE ratio has dropped dramatically down to 31 from a high of 80. Buffet is a major shareholder of this stock, and although he is down on it and admits he overpaid, he has expressed his intentions to keep it. There has been a lot of trouble and bad news for KHC, but this could all be marked into the price now. Long opportunities on this offer decent upside potential.
From a technical viewpoint, a long term downwards trend line has now been broken, with the current bottoming happening just after the big one day drop. Trends are most often inclined to end in these sorts of dramatic moves, and the forming of a double bottom and break of the trend line after such a move gives the opportunity to buy in and stop loss under the double bottom.
Swing trade: Buy KHC 31. Stop loss 23. Target 77

Kraft Heinz inverse H&SAfter losing 67% from all time highs. The stock is showing promising potential for reversal.
Inverse H&S pattern with divergence and a clean break of the down trend line. Now just above the 200SMA.
1st target is to close the gap.
Good Luck!

KHC Inverse Head and Shoulder targeting just under $42Looks like KHC has hit a potential bottom with a formed an inverse head and shoulder.
Monthly PSAR flipped bullish.
Targetting the 23.6% retracement which matches H&S measured move at just under $42

Kraft Heinz: Buy OpportunityThe price bounced from the support zone formed by SMA100, SMA200, and the uptrend line. The reversal signal could be used for buying with stop orders below the local swing low. If you missed this opportunity, the next buy signal can be based on a breakout above the local resistance level.
Entry Price: above 32.75
Stop Level: below 29.20
Profit Level: at 41.90
If you decide to take part in this trade, don't forget about the proper risk management. Don't invest all capital in one market and use stop orders.
Disclaimer!
This post does not provide financial advice. It is for educational purposes only! You can use the information from the post to make your own trading plan for the market. But you must do your own research and use it as the priority. Trading is risky, and it is not suitable for everyone. Only you can be responsible for your trading.

KHC head and shoulders bottom formingKHC has been crushed this year but now is showing in to the right shoulder of a Head and Shoulders Bottom.
Using the Edwards and Magee 3% entry rule I have an entry of $34.42 and a measured Target price of $41.55.
This one sits of the watchlist.


KHC, Kraft Heinz Co. - Potential Breakout on H&SNASDAQ:KHC
One of the best set ups.
Currently on Kraft Heinz is developing a classic reversing head and shoulders.
It is also one of the companies in the portfolio of the world's largest investor, Warren Buffett.
If we think about the potential recovery on the stock value, the Risk Reward becomes remarkable and the % of trade realization at profit remains as usual around 45%.
So we've set the alerts and we're waiting for a neckline breakout.
Stay Tuned!

KHC Trend ChangeBroke a downward channel, forming a mid-long term trend change if we can get above $32 gap fill way above here near $48, starting to add to this position while I scale out of my OXY calls.

KHC Elliott Wave w/ Support and Resistance Im pretty bullish in the short term on Kraft leading up to investor day - support and resistance levels represent decent trading ranges

HEINZ: Strong Value for 2020; Wait for ConfirmationOver my past several ideas I have been discussing about "value for 2020" and here is yet another example of one. Contrary to some of my other sectors that I have touted (which have already built momentum), HEINZ still has quite a bit of short interest and negative momentum.
However, this is an example of a stock that got slaughtered in 2019 and due for quite a drastic run up - when that happens is anybody's guess specifically but with a new CEO, a stock thats heavily undervalued and a juicy dividend, its hard to resist buying and holding.
With a likely short coming sometime in 2020 in Q1, I see little reason why the stock doesn't close the gap to just below $29.00, in which case the stock would be a good buy. If not, we would want to wait for a further push above this month-level consolidation before putting in a buy.
- zSplit

Ready for the next leg upNice .786 retrace within a upward trending wave pattern. I like the chance of a move higher compared to a move lower - place your bets

KHC Inverse H&SKHC has formed left shoulder and head, time will tell if the right shoulder is formed. Possible island bottom also. Rising MACD shows promise also.

KHCcanonical in volume and shape reversal model H&S (head and shoulders)
- the Golden cross is formed"
- the asset is above all daily moving averages
- volume output
Strong Buy


KHC - Inverted Head and ShouldersQuick update on KHC idea. The stock still goes through accumulation phase. Accumulation takes lots of time and it is better to switch to weekly TF from daily to see the progress. On weekly TF I see the inverted head and shoulder pattern showing up, allowing us to project targets if it plays out and breaks neckline. Weekly 50 Simple Moving Average is also at a neckline level right now providing resistance. It needs to be broken to confirm bigger rally.

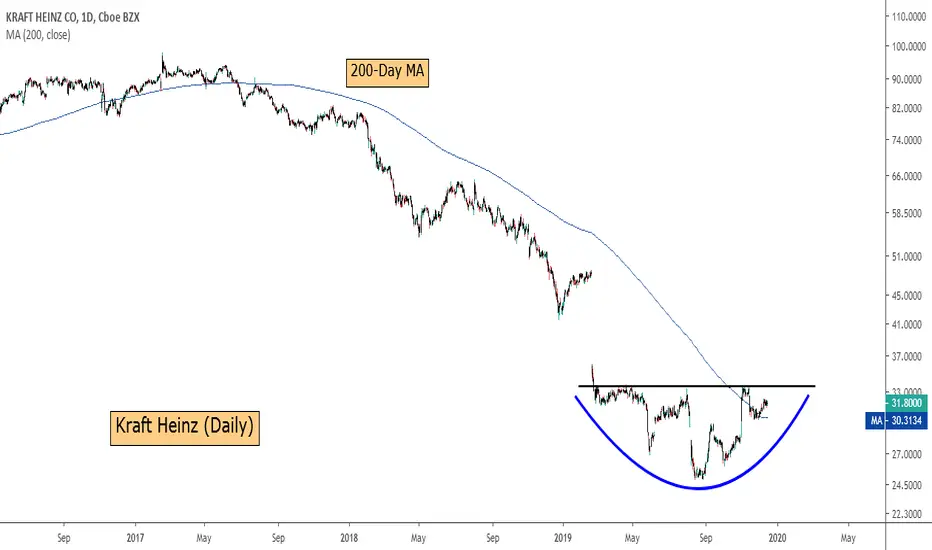
Kraft HeinzKraft Heinz | KHC has spent the last two and a half years in a downward trend, having shed 66% from it’s peak of 93.21. Now, the technical setup is signaling the potential for a reversal of the downward trend with the price having regained the 200-day moving average and having formed a 10-month base by way of an inverse head and shoulder formation. Two daily closes above the resistance level of $34.25 triggers the technical setup for move back to $42.
KHC heading higherPrice action should continue higher this week. Looking for a nice move to the 33.37 level.

KHC - Potential 5th Wave Long Swing Trading OpportunityUsing our Elliott Wave Indicator Suite for the TradingView Platform we have identified a potential Long 5th Wave Swing Trading Opportunity for KHC on the Daily time frame . The 5th wave move in an elliottwave sequence is the highest probability move.
The wave 4 pull back has found support in the Amber zone of our probability pullback zones, which represents an 80% probability that our automated 5th wave target zone, in blue on the chart, will be hit.
We see yellow dots formed in the overbought zone on our special False Breakout Stochastic indicator, which signals strong Bullish momentum. When, during a wave 4 pullback, the stochastic pulls back against these false break out dots and crosses in the oversold zone, there is a high probability the stocks price action will resume the overall bullish trend .
We also measure the wave 4 behaviour with our Elliottwave oscillator, which has pulled back within our pre-determined zone.
So overall we have identified, using our Elliott Wave Indicator suite for TradingView, a high probability long swing trading opportunity for KHC , Daily Time Frame , with the following entry strategy:
Long entry through $31.63
Stop Loss $29.98
Target $34.50
Giving a Risk to Reward of 1:1.6
Learn more about our Tradingview indicator suites by watching the video tours >>HERE<<

KHC Reversal?Christmas shopping might just be around the corner, waiting to see conformation will probably be a longer waiting game for this one. 180 EMA is looking better but we'll have to stay and see where this goes, dividend is good. Keeping on eye on this for now, bullish so far based on what it's show the past 3 months

H&S time for reverseSeem that KRAFT after the huge drop, in the chart is forming an interesting Head and Shoulder pattern and so a reversal in trend, let see what will happen in these coming weeks
