Market Neutral Idea: Long LHC/ Short MEIBottom line: Among other metrics, the pairs looks stretched to the downside and the performance gap has widened. A bounce looks possible from around these levels.
Current Level: 0.3237
Stop: 0.3115
Target: 0.3500
L53 trade ideas

LHC flag LHC pulling back to support in the form of a flag. If a reversal takes place around support and the flag gets triggered a move back to resistance at R25 can be possible.
Trade ideas are my own and not financial advice.
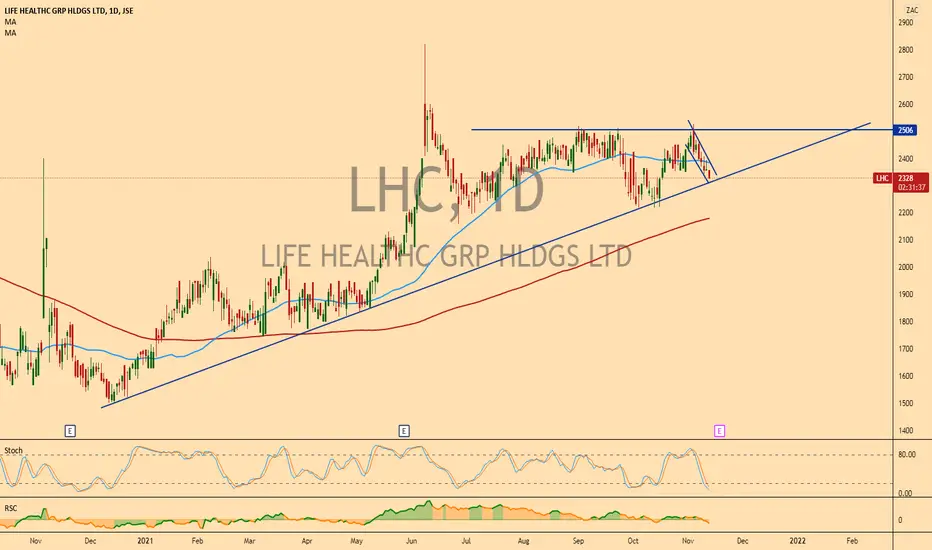
Life HealthcarePennant technical pattern building up, which if broken may take price to 30 and above.

Watching possible IHS setup on LHCPossible IHS setup here in LHC. The IHS looks more prominent on monthly chart. Watching this closely

Ascending Triangle We have a beautiful and wide ascending triangle pattern on the stock. The stock continuously makes higher lows. The R25.80 level has been wall above. Market has been trying to pierce this level but it stood strong. If the stock finally closes through R24.82 I will raise my stop loss to R23.90 and add to my position.

Ascending Triangle We have a beautiful and wide ascending triangle pattern on the stock. The stock continuously makes higher lows. The R25.80 level has been wall above. Market has been trying to pierce this level but it stood strong. If the stock finally closes through R24.82 I will raise my stop loss to R23.90 and add to my position.

Life Healthcare - How I'm Seeing ItPreviously I called a long on LHC at 1977c (13 May idea attached), citing the relative strength vs the broader market. The name traded above 2800c less than a month later, driven by the Biogen/Alzheimer's news.
Comparing the current price structure to Biogen in the US, I note Biogen having previously developed a bearish flag formation which was a precursor to the recent move lower.
Could LHC follow a similar structure in the short term? Here are two scenarios:
1. From the immediate structure, the 2390c level needs to be breached, as confirmation of the downside move.
2. If it trades higher then a level will be confirmed but preceded by a break of the channel support.
I'm monitoring for a short term opportunity.
For more high quality insights and real-time trading ideas, get in touch today.

Life Healthcare chartNice Cup and Handle building up on Life Health care. Now its just waiting for a the 2450c neckline

LHC ascending triangleLHC formed a small ascending triangle pattern which triggered with the close above R23,50 to target the R25,50 - R26 area.
Ideas are my own and not financial advice.

Life Healthcare - Also Strong On A Relative BasisLHC looking quite strong in the face of a broad-based sell-off. Share trading at multi-month highs, having developed a rounding base formation. Also note the share on a relative basis versus the All-Share - breaking the downward trend line extending back to March 2020.
Similar to offshore healthcare names (XLV ETF) which trades at a 3-month high vs the S&P 500 (SPY), it may be another place to hide as risk assets sell off.


LHC: mean reversion tradeRemains close to the upper range of the linear regression channel pattern (see the blue and red parallel trendlines).
Retracted from overbought territory.
Downside price momentum supports the bearish trend.
Bearish trend applicable below 2114.
Strong trend is applicable according to the ADX.

LHC one to keep an eye on.LHC have some significant resistance at R20. It closed above that level. If it can hold above that level we might see a move higher.
Ideas are my own and not financial advice.


JSE:LHC Life Healthcare Continues DowntrendLife Healthcare has tested the overbought line. There is now a high volume rejection and the downtrend can be expected to continue. This is confirmed by negative divergence in the volume RSI and a downward trending relative strength to the Top40.

Looks like the R16 is the floor for Life Health Care. Or is it?Life Health care seems to have found some significant support at that 1600 level. Traded below past couple of days but closed slightly above it. But if we take out and close below that 1556c low. I'm interested in shorting the share

$JSELHC Life Healthcare. Bear channel challengeLife healthcare is challenging a 6 year old bear channel on the news of the possible FDA approval of Biogen's Alzheimer's drug. Could be a significant for LCH's NeuraCeq Alzheimer tracer used for diagnosis. Share up strongly and very volatile today. I would wait for a break of the bear channel before entering the share. Anything before that would be pure speculation.

Possible Swing Trade - LHCRSI and MACD suggest there may still be more movement downwards giving rise to a possible buy in close to the support level around 1585 once the RSI converges
Buy in @ 1585
Stop Loss @ 1545
Target @ 1800

NTC: will the volatility squeeze work again?Might be a slow price action to get to the profit target.

A nice trend continuous Head and Should of Life Health GroupJSE:LHC
A Head and Should on a down trend continuation.


LHCHealthcare stocks, with the exception of Aspen Pharmacare have been laggards within a strong overall market. Life Healthcare (LHC) has caught my attention as a name with both short term and long-term upside. For now, I will stick with the short-term where the following technical characteristics suggest underlying strength:
- Recent falling wedge breakout off a strong support zone (1650-1680c), followed by a retracement/re-test of the breakout level.
- MACD indicator making higher lows while price has remained flat. (Upper panel)
- MACD indicator has developed a bullish crossover. (Upper panel)
- Money Flow Index is trending up (lower panel)
- Strong candle structure at the 1765 pivot (P) - typical big green candles at the pivot are indicative of buyers eager to push the price through the support zone.
- Also note Wednesday and Thursday's massive volume.
- We would look for a move through the pivot (P) of 1765 and then 1780c as confirmation as well to add further conviction to the upside potential.
- On the upside, targets would be ~1876c and ~1930c.
- Stop: 1680c

JSE:LHC Life Healthcare SpringAfter a high volume selling climax (SC), we have seen an automatic rally (AR) back to the previous trading range in the downtrend. Now we can expect the price to range at these levels until a new cause has been built. The spring occurred short of the oversold line indicating some strength. We will watch how the trading range develops to see if this is possibly an accumulation trading range.
