Potetial inverse H&S Close above R144 triggers the long idea of an inverse H&S. 1st target is R160 and full target at R210. This will require some serious legs if it were to pull through.
LCQ trade ideas

ExxaroBullish looking ascending triangle chart pattern on Exxaro daily chart; provisional levels on chart.

EXXCurrently trapped in the Demand Zone, look forbuying entries to go long on this towards the supply

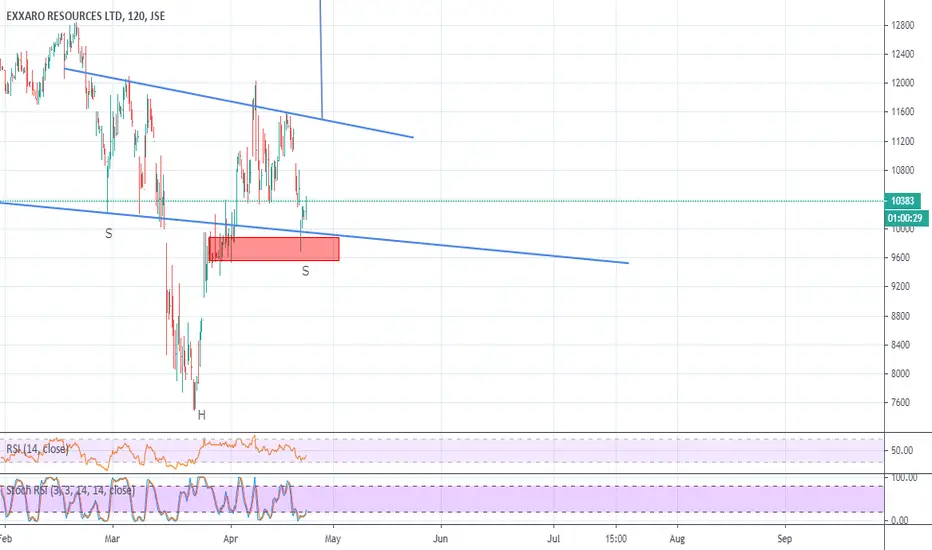
Head and Shoulder on ExxaroBearish head and shoulder technical chart pattern forming on the Exxaro daily, with a measured target of R112. Neckline support around R126 is the critical area to watch.
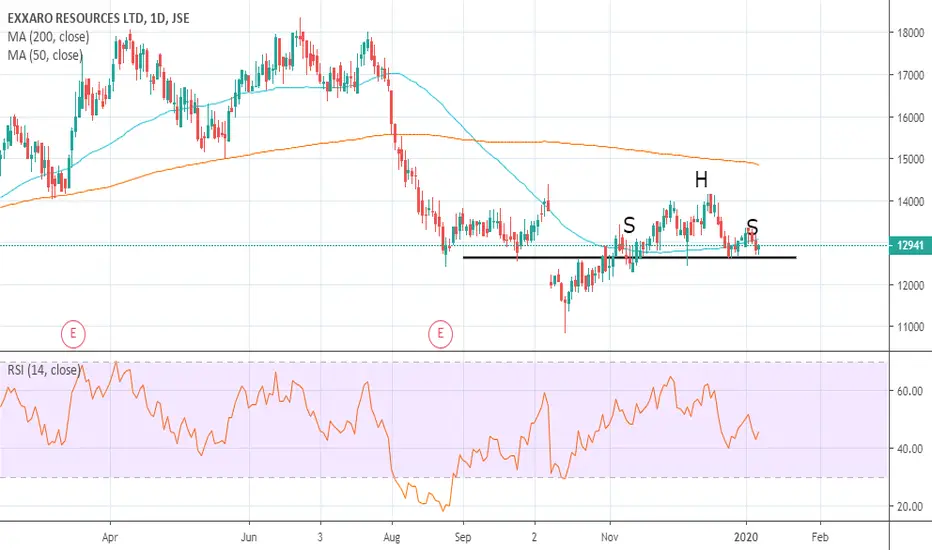
The sun will come out... ExxaroEXX seems to be forming an inverse head & Shoulders pattern at the bottom of the trend (in my mind anyway). RSI looking strong enough to buy on a slight pull-back but I certainly will not be chasing it. If the pattern plays out, I reckon we will see the price make a run for the 200 day Moving average.

Exxaro trending up to R150Exxaro $JSEEXX trending up nicely after having fallen after the payment of the special dividend. On the weekly chart, share price looking like it should reach R150 where it will meet a strong previous support line and its 50 week moving average


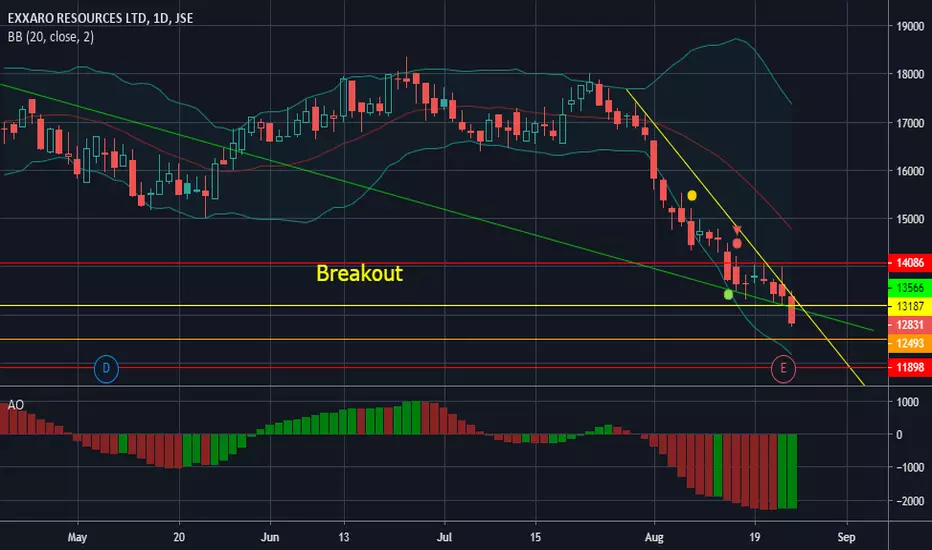
EXX not breaking through supportJSE:EXX has been struggling at a support level since late August. It doesn't seem like it is going to be breaking through any time soon, so I am looking out for confirmation to possibly enter a long position. If it breaks through the fractal of the 27th of September, I will consider entering.

EXX possible continuation or Trend ChangeEXX . RSI and MACD Both in Agreement
with bullish Trend Signalled
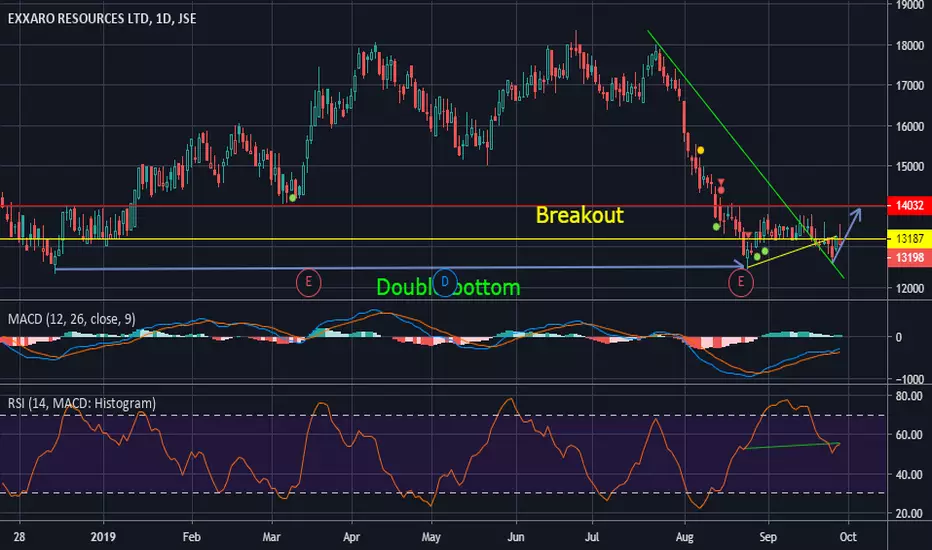
Double bottom on ExxaroSeeing a bullish double bottom technical chart pattern on the EXX daily chart.
Waiting for a confirmation in the form of close above the R136 resistance area.
Watching for now!

EXX Trade IdeaBuy/Long EXX at current levels of 13390c or lower
Stop-loss: 13000c
Take Profit Target: 14200c
Trade Type: Medium Term CFD
EXX - time for a correction rally?A conflux of technical indicators supports a bullish bias.
Setup remains risky as it is only an expected counter-trend relief rally.
The blue line on the main chart is the lower two standard deviation range. Increasing probability for a relief rally as the price action is overextended to the downside.
MACD (lower panel) confirms a bullish trend direction.
Retracted from RSI oversold territory.
ADX forming a peak - hinting that the previous strong bearish trend is losing momentum. This might support a bullish price action.
Time to exit: +/- 13 September 2019

EXX - New Bear Trend We may derive the following from the Weekly EXX chart:
1. Price has broken our major 2016 uptrend.
2. It is probable that price will continue to decline.
3. Watch for short opportunities.
4. As always - maintain your risk.
Note: The views provided herein do not constitute financial advice.


EXX Double bottomJSE:EXX failed to break through a previous low and has formed a double bottom pattern. We could very well see an upward swing from here. The stochastic also seems to be confirming the move.

JSE:EXX Exxaro Breaking DownExxaro has been in an uptrend but the stride has been broken. There is divergence with the Volume RSI and more downside can be expected. Waiting for a pullback.

ShortEXX trading as expected broken significant Resistance levels and making new lows the one to watch today

$JSEEXX - Update: Breaks downExxaro reached TL support as previously expected, but continued to break lower.

EXX at supportJSE:EXX is approaching a significant support level and could possibly bounce for an upward move. Stochastic is confirming the same.

EXX - Spot on! Where to now?We may derive the following from the Weekly EXX chart:
1. Price has reached our channel support (See linked idea).
2. Majority of profit can be taken.
3. A bid is most likely to occur at the support (pink line) - however a break of the trend is possible.
4. Monitor price action.
5. As always - maintain your risk.
Note: The views provided herein do not constitute financial advice.

$JSEEXX - Headed towards TL supportExxaro could potentially drop to around 145-ish before we see a significant bounce (TL support)
