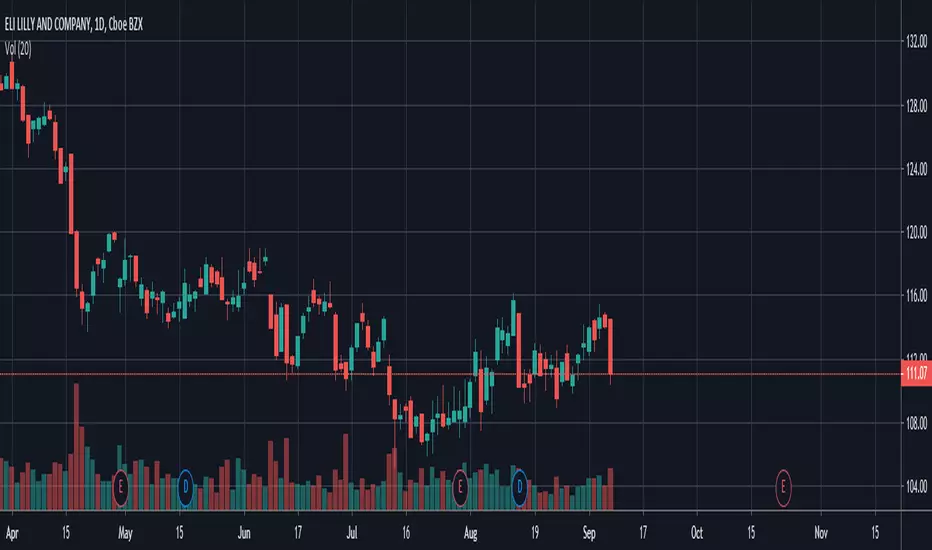
Eli Lily Double Top PatternMajor insider selling coming from 10% owner Lilly Endowment Fund (Roughly 500M shares)
LLY trade ideas
$LLY daily supports my previous short thesis$LLY daily chart is currently sitting at the neckline of an inverse head and shoulders -- which also supports my short theory. I BTO 15 MAY 130P on $LLY

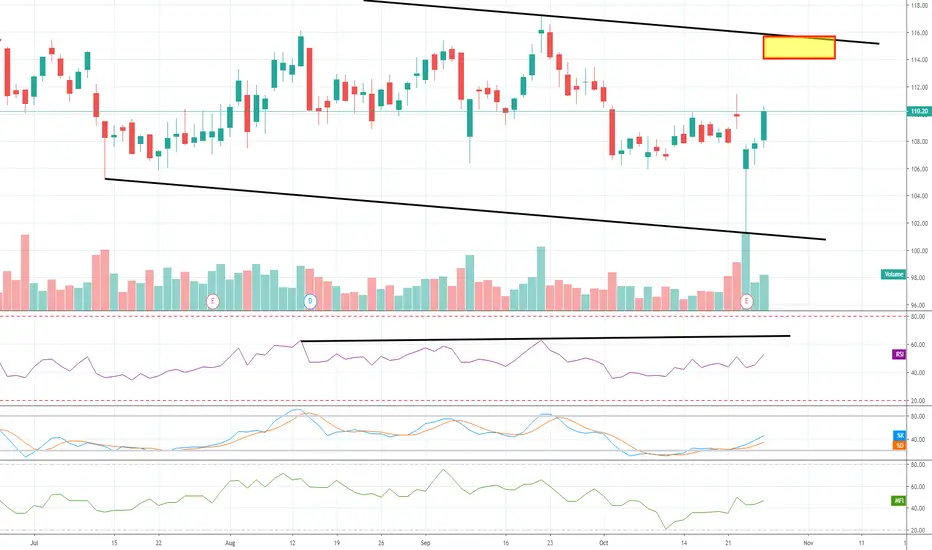
$LLY possible short$LLY monthly log chart at top of channel with a bearish RSI divergence. might be a decent short.


ELI LILLY bounce long This drug company sign agreement with another company for some kind of treatment for virus that is going global and also the daily and one and four hour chart is showing a nice trade set up for intra day long

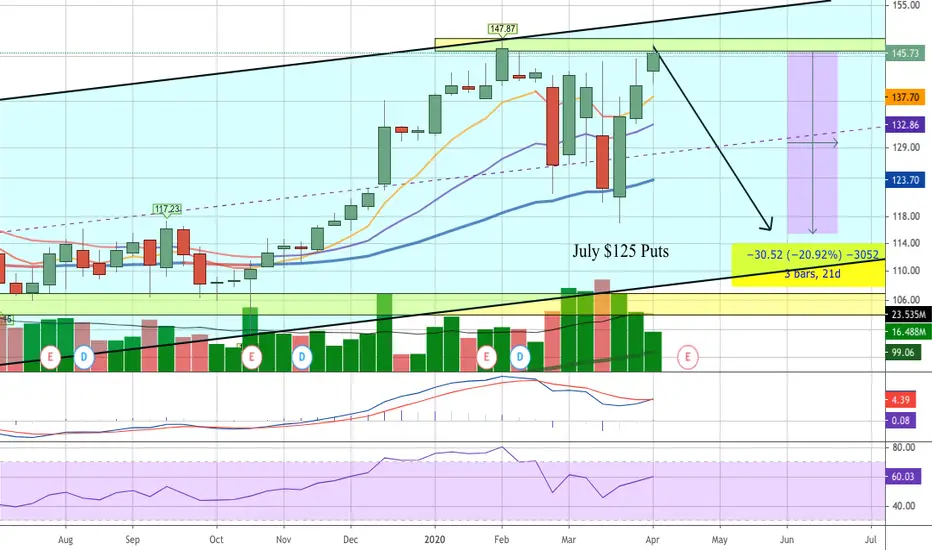
LLY Sell the RallyMy dowsing method suggests LLY gets their FDA approval, and the stock will pop, but that in the longer term, this stock is going to breakdown; probably with the entire market.
I'm getting that the resistance will be around that $145-46 zone, which would also be a test of the uptrend line from below. Good luck!

US FDA approves only triple-combination tablet with Jardiance® fLLY: Eli Lilly and Company
2020-01-27 17:34:00
US FDA approves only triple-combination tablet with Jardiance® for adults with type 2 diabetes

LLY trade shortIf LLY breaks down from the yellow candle today and opens below their and holds on the 15min chart, I would short it.


Golden Cross In Eli Lilly Entry level $133.35 = Target price $150.00 = Stop loss $130
Golden cross just completed.
Stock on verge of breakout after building a fantastic base in 2019.
Alert set for break above $132
Company profile
Eli Lilly & Co. engages in the discovery, development, manufacture and sale of pharmaceutical products. It operates through the following segments: Human Pharmaceutical Products and Animal Health Products. The Human Pharmaceutical products segment includes the discovery, development, manufacturing, marketing and sales of human pharmaceutical products worldwide in the following therapeutic areas: neuroscience, endocrinology, oncology, cardiovascular and other. The Animal health Products segment operating through the Elanco Animal Health division, develops, manufactures, and markets products for both food and companion animals. The Animal health products include Rumensin, Tylan, Posilac, Paylean and other products for livestock and poultry, as well as Trifexis, Comfortis, and other products for companion animals. The company was founded by Eli Lilly on May 1876 and is headquartered in Indianapolis, IN.


LLY - DAILY CHARTHi, today we are going to talk about LLY and its current landscape.
We can observe at this timeframe, a confluence of technical factors, that entail a setup which might drive this asset to a new movement. The details of our analysis are highlighted in the chart above.
Want to know more about our trades and ideas? Join the Traders Heaven today.
Thank you for reading and leave your comments if you like.
To have access to our exclusive contents, and see more of our work, join the Traders Heaven today! Link Below.
Disclaimer: All content of Golden Dragon has only educational and informational purposes, and never should be used or take it as financial advice


[ALGO TRADE] LLY ShortNot enough in capital to buy the stock but would have placed positions as such. Let's see if it hits TP

$LLY Nice bullish setup for short term target 115 Long doji green candle at bottom supported by 2 days run up targeting 115 .. for long term LLY intend to decline
ELI LILLY and Company -LLY- Long - Bulissh Divergence and TailBullish divergence on the weekly and on the daily I see a missing right shoulder bullish divergence.
After this strong price recejection, I expect a move up at least to this projected target zone. From there on, it could move up even more, but the trade is here to find a nice exit and perhaps reenter, or partially stay in this trade.
If the reversal looks real solid, I might stay in the trade and setup a trailing stoploss.
Entry will be around 110, but I first will see how the market opens on monday.
Entry: 110.20
Exit: 117-120
SL: 105
R/R: 1:1,4 up to 1:2,0


LLY: Earnings Play. Current wave iv retracement is at Fib 38.2% which is typical for waves iv. A great ER could cause a gap and go. LLY is currently is a steeper meltup channel. A good ER will continue the meltup. A bad ER could cause a gap down to the lower channel and the Fibn 50% level. A horrible ER can cause it to drop far enough to meet the HnS target of $91 and the Fib 61.8 level

lly fails at 200nice spot to get short against on back test of 200 here, staying patient as we could grind for a few days, but if the 50 crosses 200 strong short op

