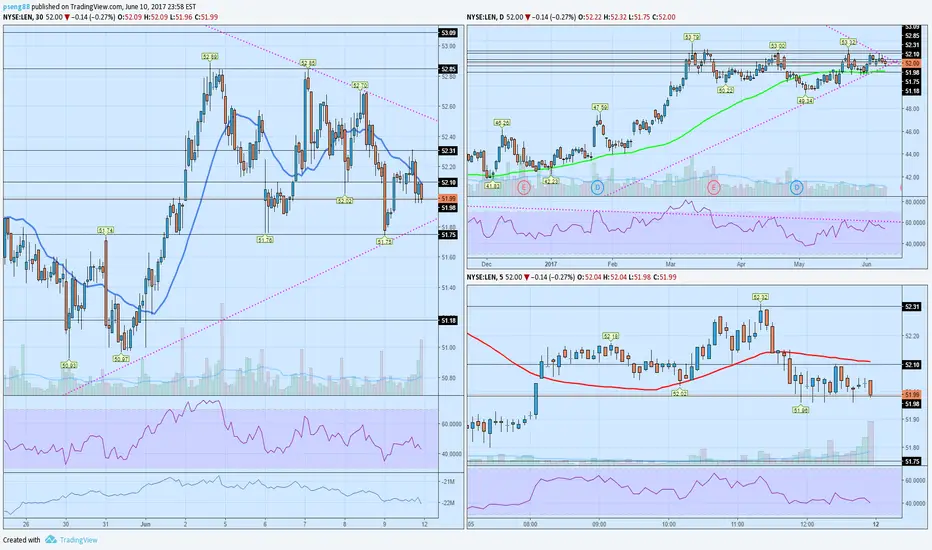
can Lennar built it?Hope everyone had a nice three days break from the market. Let’s go to the chart we are going to focus on this home builder Lennar. On my scan it shows inside bars for the day and, the week of the class of A. On the weekly chart ended with a hammer red so the question is would this stock continues to dump or reverse and, break out to new highs
LNN trade ideas


October 3 Earnings: Lennar - The Luxury Housing God Lennar has had an impressive performance record with a recovering economy and housing market.
The company's continued effort on Real Estate development and Financing is fueling sales growth.
Earnings should get a boost from cost cutting and operational efficiency efforts.
Sales, however, are expected to dampen in the quarter with 120 homes deliveries postponed due to hurricanes.
Rising construction, labor and land costs are expected to damped earnings luster.
I believe the company will provide healthy guidance and beat expectations.
I'm starting Lennar with a $60.00 Price Target heading into 2018.

Trade Update ---4 days into trade---In the trade from low $52s. Added at $55.
Weekly view shown here.
Looking for strength to continue here. Currently they are testing resistance levels from the 2006 and 2007
Feedback and comments are appreciated.

Outstanding setup --Flat MA--Really loving what we have here!
Top side resistance on RSI just broken. Look for MACD zero crossing.
Notice how the 100MA is flat. Often times when a flat MA is broken, along with top side RSI resistance break, an expolsive move follows.
If you agree please leave a like.
Follow for more
Comments are always welcome
:)

$len losing momentum/distribution higher time frame is showing range bound price action- negative divergence in rsi
closer look at mid time frame shows the transition from a range expansion to range contraction and selling volume pressure being applied along with negative momentum
lower time frame shows price action in that same range contraction apply pressure to the support area with multiple retest
looking for alignment across all timeframes to tilt to the bearish side where theres is the least resistance to the downside
first level to 51.7x area and then down to 51.1x
Lennar Buying the pullback here to this nice demand zone (highlighted in yellow) which should act as support here. The level also happens to be at former resistance which should now give the level further support. Use the entry, stop and target prices below to control your risk vs. reward on this trade.
Entry: 49.97
Stop: 48.99
Target $53


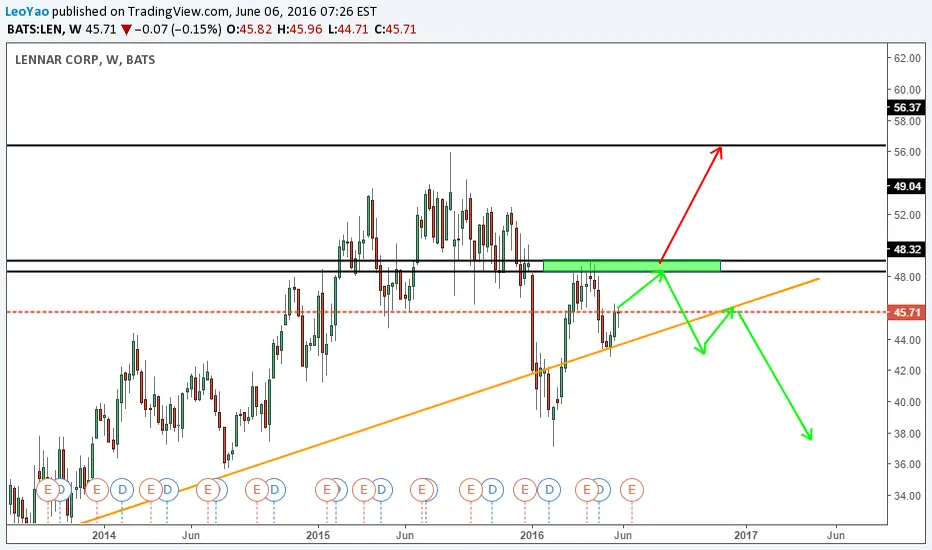
Follower's Query On LENPlan A (Green line, which is my preference): Short from Green Zone if cannot break the zone.
Plan B: If break green zone, long it till previous high.


Lennar- Bearish Sentiment So Far, Looking For More DownsideIF IT opens LOWER tomorrow this is probably worth a short.
IF IT DOESN'T open lower, then it probably isn't.
There is also a potential bullish crab, bullish bat pattern(s) setting up. I have market their completion with lines and callouts on this chart encase harmonic traders are interested to trade these harmonic patterns in the future..


Lennar Technical Analysis: Bullish Continuation!Shares have completed a bullish breakout and consolidated above the resistance of the ascending triangle formation and also the 61.8 retracement level, which was a key area within the past few months.
The breakout suggest continuation of the bullish trend that started from 2009, where the minimum measured target for the triangle is around 55.00 areas..
Be one of the first members of my new trading portal, check my new website thefxchannel.com , vote and subscribe. Thank you
Good luck, keep your stops tight..
twitter.com
www.facebook.com
plus.google.com
My best regards
Technician

LEN the case for a re-test of $48 potential building Possible March OTM bought call opportunity to take advantage of positive bounce in this sector. Note there is housing data out next session which is worth delaying to see market response.


LENOld chart - a break above 44.40 could be bullish. VERY hard to trust these builder stocks and the upper band seems to be in the way here. One to keep on the radar


It's about time for the housing stocks to rally.With TLT soaring, you would think housing stocks would catch a bid.

