20 inboundbeen watching awhile 4hr looks great to run there are daily averages overhead around 17 but i think we break above to 20 then confirm support at those averages.
M44 trade ideas

$MARA still going to go under $10Even though NASDAQ:MARA has bounced, we're still not completed with the correction.
So far, we've only completed 4/5 waves down and the last leg should take us to the supports below.
I think the most likely target is at $7.64, but other two support levels possible as well.
Let's see where we end up.
Those levels will mark a great buying opportunity for the future.

MARA...Poised to turn ??MARA Holdings, Inc. is a digital asset technology company, which engages in mining cryptocurrencies with a focus on the Bitcoin ecosystem.
They have a current P/E of 8.18 and a slightly positive seasonal rating.
Generally there is a fairly good correlation with BTC.
Technically I see several patterns at present:
1. A Bullish Wolfe Wave
2. A Complete ABCD pattern
3. A Longer term Harmonic Bullish Crab pattern.
4. Positive RSI divergence appears to be present,
I point this out being fully aware of the present chaos the market is in.
Specifically :
1. With a Tariff Policy probably formulated from a CHATGPT search by a DOGE junior staffer.
2. Where s 401(K)s risks becoming a 201(K)s.
3. Where the Waffle House appears not to care and but can shift and change policy at any point.
4. Analysts estimated are positive (insert)
That said and with a stronger BTC and a generally positive market shift, I believe MARA will participate.
Note: There is a longer term crab pattern in play which suggests we may bottom out around the $7 area.
We need clarification and a reversal of currently ill advised and destructive tariff policy.
I will entertain a long position if we close above the $11.60 area with volume, a stronger BTC a positive market outlook and tariff nullification.
My Targets are marked. Analysts targets ate an insert.
Q4 and Full year earnings are set for early May. Q3 exceeded expectations
This is not Investment advice. Do your own due diligence.
S.

Mara Like a Phoenix Reborn #USA Gann's Law of Vibration showing us what's to come.
The vibration has reset and new highs will be made.
On balance volume about to go parabolic.
Implied Volatility follows.
Time to make money.
"Time is the most important factor in determining market movements and by studying the past records of the averages or individual stocks you will be able to prove for yourself that history does repeat and that by knowing the past you can tell the future. There is a definite relation between time and price. Now, by a study of the time periods and time cycles you will learn why tops and bottoms are found at certain times and why resistance levels are so strong at certain times and bottoms and tops hold around them. The most money is made when fast moves and extreme fluctuations occur at the end of major cycles.” - W.D. Gann

Mara has entered an extended bear cycleI do not expect Mara to change trend until at least September 2025, which is based on past data. There will most likely be a push up to the 50 SMA/EMA at some point in the future but It will most likely be rejected , which has happened in the past. Mara is only good for day and swing trading and any long term investment will just fester for months. I have higher confidence that all targets will be hit during this time. I will update when there is an actual trend change.

MARA Holdings, Inc.: Your Altcoin ChoiceThis is obviously not an Altcoin but it was requested in the Altcoin Choice session that we did recently, so here is the analysis.
MARA Holdings, Inc. (MARA) . It looks good.
A long-term higher low has been established. MARA produced a low first in October 2023. This was followed by a series of swings and waves. Reaching the later part of 2024, the action turned full bearish and now in April 2025 MARA Holdings seems to be ready to go bullish again. And here the stock printed a higher low.
A long-term higher low will lead to a long-term higher high. The last peak happened in February 2024 at 34.09. The next higher high at 42.86 is an easy one and should happen in 2025. It can definitely go higher but I am no stocks expert so can't dig any deeper for you.
In support of these signals, I looked for the RSI and found a small bullish divergence. It is only a month old but it is still a bullish divergence and it is valid. The reading on the RSI is also good and supports a new wave of growth. It seems Crypto and the stock market are now one.
Trading volume is standard and average and does not support our bullish bias, but it doesn't negate either. Average volume with no change on the upside or downside supports a neutral market. A market on autopilot. If there was a bearish move this bearish move is not strong as it is not supported by volume. So the early reversal signals can be good as there is nothing to hold the bearish wave. Things can change, but we are not talking about that, we are looking at the chart and what it currently says.
The chart is saying that MARA can start to grow in the coming weeks and days. If this growth develops, it can last months and end up in a new high, a higher high based on the long-term.
Thank you for reading and for your continued support.
Namaste.

Mara Holdings - get out now!Bearish set up (price to move lower)
Its made a wedge and the height of the wedge takes it back to the all time low, which could be exceeded as over 95% reduction from the apex of the pattern.
Hopefully people get out of this if you have a bearish point of view as quick as possible and any rallies are to be sold if you are bearish
Long term, over the next couple of years this pattern does not look bullish to me at the moment
If it breaks upwards and subsequently moves over the apex point then this bearish pattern is voided and the bull market returns. If it pops back under again then this ones really in trouble.
Wishing you luck with your trading, if you are a novice then this is not a good instrument to play in with potential for it to practically go close to zero which is unusual for a stock. If you work for them hedge your share options and keep your CV updated.
Some of the market makers are stopping taking short positions on it now, to hedge your holding that usually means an imbalance and excess of short interest possibly with a full order book at for the market makers and they do not want to take on any more downside risk.
Please be careful if you are retail.

Marathon Digital.Soon parabolic.
#USA
"After exhaustive researches and investigations of the known sciences, I discovered that the Law of Vibration enabled me to accurately determine the exact points to which stocks or commodities should rise and fall within a given time. The working out of this law determines the cause and predicts the effect long before the Street is aware of either" -- W.D. Gann

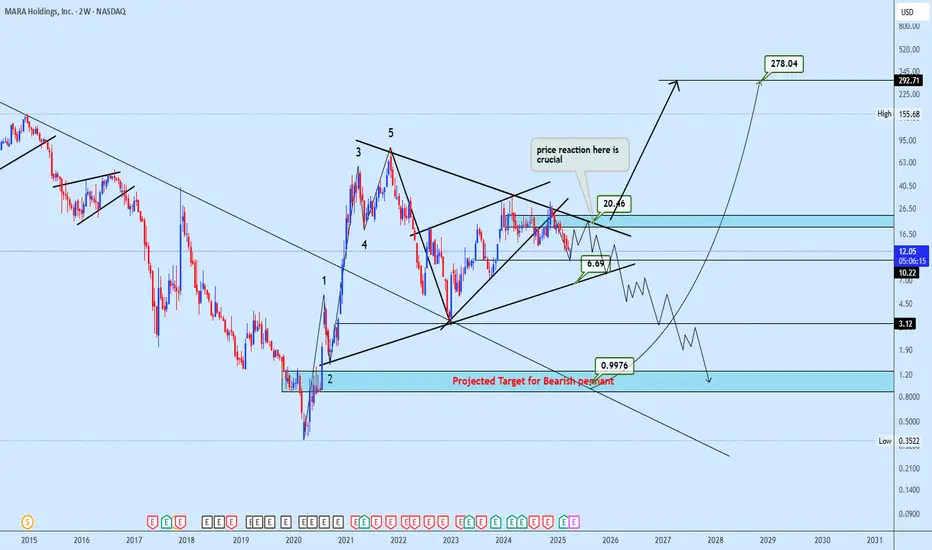
MARA's Defining Moment: Breakdown or Breakout?MARA Holdings has completed a textbook 5-wave macro impulse, followed by a complex correction, now compressing within a bearish pennant just beneath the key 20.46 resistance.
This level marks a crucial pivot, failure to reclaim it may trigger a steep drop toward the 0.9976 zone, while a breakout above could unlock exponential upside toward 155.68 and 281.27.
The coming price reaction will be decisive in shaping the next macro narrative.
MARA Long 30RThis probably seems crazy and I’m surprised myself but everything about this looks bullish to me.
Bitcoin is holding up exceptionally well given the stock market turmoil which is very interesting.
Now that we’ve seen about a 20% ish decline in the US indices we could at any moment stage a rally and I think that starts most likely next week.
What I think happens is that Bitcoin makes a higher high while the stock markets make lower highs before they both crash.

Bullish scenario... sort ofThis messy chart is how I view the world of crypto. This chart is in log and shows what I believe is the cycle of crypto miners and crypto in general. For this to play out I would want to see a bounce at the target one zone or just beyond it and then there will be a bounce, which is the final c leg up before the real correction begins and could take mara to the very lows, past target 2. This final leg up would last until about september to october before the correction. Only time will tell and this is highly optimistic with the way current price action has played out. Please note that my elliott wave analysis is far from perfect and I make changes to when to correct errors in my interpretation of the rules and this is one possible scenario. Will update as required.

MARA LONGMARA will bullish in some days, Long to 16$
Multiple divergences on ADV, price fall, but ADV stays bullish


MARA Running with the BULLS Looking to shoot for $20The share price of Marathon Digital Holdings Inc. (NASDAQ: MARA) has rebounded from strong support at 12.20 USD. Given the upside potential and momentum, there is a high probability that the downward trend will be reversed. The next target for growth could be 20.60 USD.

KEEP TRADING SIMPLE - DAY TRADE ALERT - MARAGood Morning,
Hope all is well. MARA about to cross bullish on volume! This will create another leg up - perfect for a day trade. This trade would yield approx 6-13% could be held over a day or two day period.
Thanks
Tightening liquidity in #BTC is hidingTightening liquidity in #BTC is hiding in #MSTR, how that affects #MARA we will see this week, I'm getting in longer Monday

@MARA potential double-bottomWatching NASDAQ:MARA closely as it's forming a potential double-bottom pattern. Two key points that caught my attention:
Increasing volume: Recent volume spikes suggest growing interest and possible accumulation.
Bullish Divergence: Technical indicators showing divergence, hinting at a possible reversal upward.
My plan: Wait for confirmation of the double-bottom formation. If validated, I'll enter the position targeting take profit around $20.

MARA Hopium. Uptrend to resume hereMARA has been very hard to hold during the recent collapse. It’s now very undervalued both fundamentally (as compared to their BTC HODL and recent earnings) and technically.
The supertrend indicator has triggered a BUY for the first time in 2025. Also RSI is positively diverging and green volumes are picking up.
This could start an incredible short squeeze given short interest is above 25%

5-day and one month charts indicate downward pressure continuesMara is continuing the move down to find a bottom. Notice in the past when Mara has found a bottom on the 5- day time frame and how price crosses the 5- day SMA/EMA, during the bottoming phase.
I have identified an ABC based on my Elliot wave analysis and I’m definitely not and Elliot wave expert but that count makes sense. The C wave will finish as a 5 wave down and I have identified two likely targets. However, Elliot wave is just for forecasting and decisions must be made on the price action. I the past and in similar situation, MARA candle stick formations tend to provide early clues of a bottom formation.
The orange dash line is approximately $10.78 and there could be a bounce there. It also lines up with the downward sloping channel. However; crypto miners tend to always goes to extremes and that is why the target are identified and align with fib retracement and projections. Once all indicators align a trend change will commence but now is not a good time to be buying for a longer -term positions
The link is the one month chart, which shows indicators are moving down, with the indicator below the volume has crossed the 50 line


Mara not a buy for a whileThe one month indicates that Mara will enter a long drawn out consolidation once the bottom is found. There are imbalance around the $3.50 level that will most likely be visited. Mara failed to breakout during the crypto bull run and has lost long term support levels. The bottom indicator is Accumulation and Distribution , which shows there has been distribution and no accumulation. The ADX shows that the downward pressure is actually building and the top indicator shows that MARA is repeat past decline pattern. A buy would be when indicators turn up and price crossing the 5 SMA/EMA on the monthly. It seems that it will take many months to a year before the decline stops, which is what happened in the past. Mara would not be an investment until price breaks and holds the 55 SMA/EMA on the daily time frame. Note, the one month time frame takes a while to play out and things could change but at this moment MARA is not a place to park money.

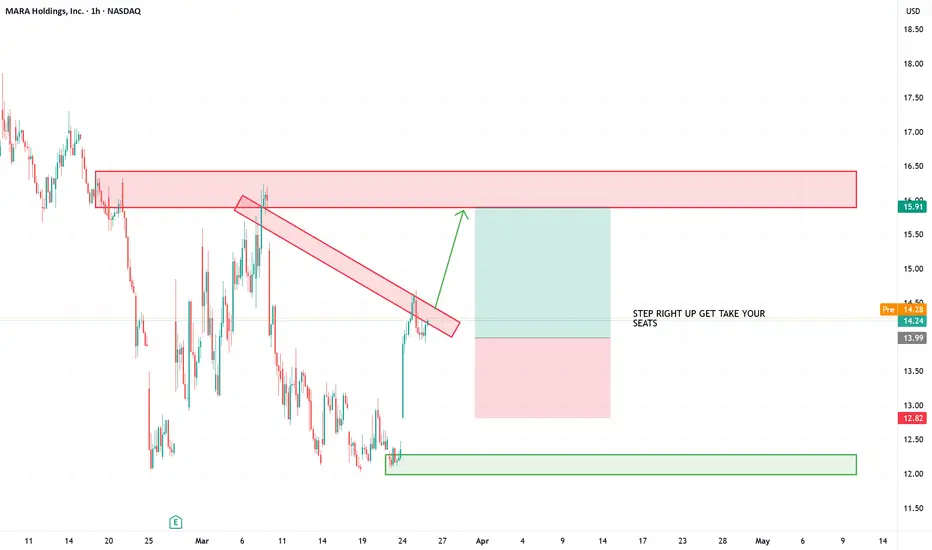
MARA: Buying opportunityOn MARA as you can see on the chart enter a buy position as soon as the second green candle appears after the vwap breakout.

MARA ($MARA) Q4—$214.4M HAUL STUNS MARKETMARA ( NASDAQ:MARA ) Q4—$214.4M HAUL STUNS MARKET
(1/9)
Good Morning, TradingView! MARA Holdings ( NASDAQ:MARA ) smashed Q4 ‘24 with $ 214.4M revenue, up 37% YoY 🌍 Bitcoin hoard hits $ 3.94B—let’s unpack this mining beast! 💰
(2/9) – REVENUE SURGE
• Q4 Take: $ 214.4M, 37% up from $ 156.8M 📈
• Net Income: $ 528.3M, 248% leap 🌟
• BTC Price: 132% boost adds $ 119.9M 💸
NASDAQ:MARA ’s cashing in—halving? What halving?
(3/9) – BLOCKS BUZZ
• Blocks Won: 703, up 25% from 562 🚗
• Hashrate: 53.2 EH/s, 115% jump 🔧
• EPS: $ 1.24, beats $ 0.32 loss call 🌞
NASDAQ:MARA ’s grinding—blocks stack, stock pops!
(4/9) – BTC HOARD
• Stash: 45,659 BTC, $ 3.94B haul 🌍
• Growth: 197% since Jan ‘24—22,065 bought 💼
• Bitdeer: $ 532M loss—ouch 😕
NASDAQ:MARA ’s stacking—rival’s stumbling!
(5/9) – RISKS IN SIGHT
• Costs: $ 127.4M energy, up 70% ⚠️
• Volatility: BTC swings sting 🐻
• Halving: $ 64.2M output hit 🔒
NASDAQ:MARA ’s hot—can it dodge the chill?
(6/9) – SWOT: STRENGTHS
• Haul: $ 214.4M, profit beast 💪
• Blocks: 25% more—mining grit 🏋️
• Hoard: $ 3.94B BTC—stack king 🌱
NASDAQ:MARA ’s tough—built to last!
(7/9) – SWOT: WEAKNESSES & OPPORTUNITIES
• Weaknesses: Energy costs bite 🙈
• Opportunities: BTC price, AI pivot—zing 🌏
Can NASDAQ:MARA vault past the snags?
(8/9) – NASDAQ:MARA ’s $ 214.4M Q4, what’s your vibe?
1️⃣ Bullish, $ 20+ stacks up 😎
2️⃣ Neutral, Solid, risks linger 🤷
3️⃣ Bearish, Costs clip it 😞
Vote below! 🗳️👇
(9/9) – FINAL TAKEAWAY
NASDAQ:MARA ’s $ 214.4M Q4 and $ 3.94B BTC pile stun—mining hauler Costs creep, but grit shines—gem or bust?
