8306 on TSEThe market is on uptrend, so the predominant decisions should be buying. On the way up, there re a few candidates. The middle one is of least qualified. The upper one can give 2:1, but while jumping into the base, it left behind a gap, so for safety measure should move SL to break even if price manages to get to the gap before breaking predetermined SL.
MFZ trade ideas

MITSUBISHI UFJ FINANCIAL _ Channel Pattern Target is JPY 1906Rising Channel Pattern formed and Breakout. Channel Pattern Target is JPY 1906. And also Rising Wedge Pattern formed in weekly Time Frame. If Breakout above the Wedge Pattern, market significantly Bullish Trend and Breakout All Time High (or) market come to the Resistance line of Wedge Pattern. Refer to this image,
Support me; I want to Help People Make PROFIT all over the world."

8306 (Mitsubishi UFJ Financial Group)Mitsubishi UFJ Financial Group, Inc. is a Japanese bank holding and financial services company headquartered in Chiyoda, Tokyo, Japan. It is Japan's largest financial group and the world's second largest bank holding company holding around US$1.8 trillion in deposits as of March 2011.
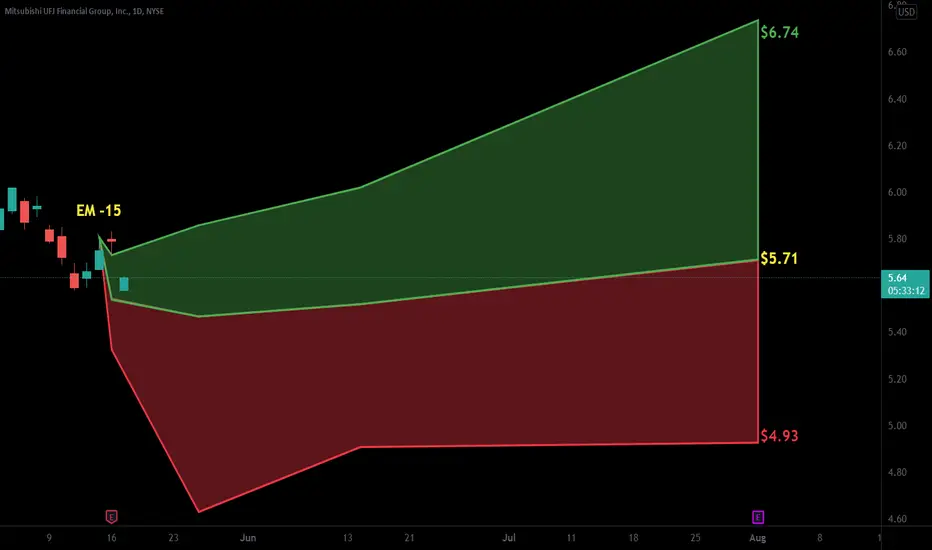
Clean consolidation. Next leg up?

Mitsubishi UFJ Financial Group, Inc.MUFG's price has been following a complex corrective pattern (WXY).
This correction was confined within a corrective channel.
An attempt to break out of this channel to the upside previously failed, indicating ongoing correction.
Recently, there has been a breakout above the upper channel line.
This breakout suggests that the WXY correction may have completed.
However, to confirm the end of the correction and avoid premature conclusions, a level of invalidation is being monitored. If a new correction starts, it could invalidate the previous breakout.
It's important to note that Elliott Wave Theory is a complex and subjective method of technical analysis, and different analysts may have varying interpretations of price patterns. Additionally, real-world financial markets are influenced by a multitude of factors, and no analysis method can guarantee future price movements. Traders and investors should use multiple tools and analyses to make informed decisions.

$MUFG with a bearish outlook following its earnings #StocksThe PEAD projected a bearish outlook for NYSE:MUFG after a positive over reaction following its earnings release placing the stock in drift B with an expected accuracy of 88.89%.

$MUFG with a Bearish outlook following its earnings #Stocks The PEAD projected a Bearish outlook for $MUFG after a Negative Under reaction following its earnings release placing the stock in drift D with an expected accuracy of 100%.


$MUFG with a Bullish outlook following its earnings #Stocks The PEAD projected a Bullish outlook for $MUIFG after a Positive Under reaction following its earnings release placing the stock in drift A with an expected accuracy of 75%.

$MUFG with a Bearish outlook following its earnings #Stocks The PEAD projected a Bearish outlook for $MUFG after a Negative Under reaction following its earnings release placing the stock in drift D with an expected accuracy of 100%.

MITSUBISHI UFJ FINANCIAL GROUP INC Month
MITSUBISHI UFJ FINANCIAL GROUP INC big volume green I think that pullbeack

$MUFG with a Bearish outlook following its earnings #Stocks The PEAD projected a Bearish outlook for $MUFG after a Negative Under eaction following its earnings release placing the stock in drift D with an expected accuracy of 100%.
Short term retracement setup for bullrun1D Heiken Ashi chart is printing smaller sized bars and wicks showing a possible trend reversal. I'm building a position here as there are several different TA elements happening across multiple timeframes.
Top level
1D: DCA into a position at 5.84
● 200EMA
● Fibonacci golden ratio 0.618
4H
Buy signal with price consolidating inbetween 0.50 and 0.618 Fib levels
● RSI increasing from 30 level
● MACD crossing up
1D
Price here is decreasing with RSI and MACD increasing
● Hidden bearish divergence
I think in the short term dip lower to the original target level. 5.84


BUY $MUFG - NR Picks Dec 19ES:
Mitsubishi UFJ Financial Group es el banco más grande de Japón en términos de capitalización de mercado y activos con una participación del 8,9% de todos los préstamos nacionales a junio de 2020. Es el grupo bancario no chino más grande a nivel mundial y tiene un balance ligeramente mayor que los de JPMorgan Chase y HSBC Holdings.
Mitsubishi como muchas otras compañías del sector financiero, ha sido duramente golpeada por la pandemia. El precio actual de la empresa se encuentra aún 17% por debajo de su precio precovid por lo cual permanece como objetivo de compra.
Fundamentos:
- Value
- P/B 0.3x VS 1x de industria
- 11.3% crecimiento estimado en ganancias netas para los próximos 3 años
- ROE 4.4% VS 8.3% de industria
Técnicos:
- Nivel de precio tocando SMA 200-100
- Williams R% en niveles de -80%
- RSI (M) Neutral
- +9% upside promedio en el último mes
Después de una corrección de 9% a finales de noviembre, se puede observar que se detuvo la venta en un soporte solido de 4.25$ el cual se ha respetado desde entonces. Como se puede observar en los datos técnicos, el nivel de precios va junto al SMA 200-100 y en cualquier momento puede romper esa tendencia que podría llevarnos al objetivo de 8%. En consecuencia, se ha optado por marcar un nivel de stop loss en el siguiente soporte solido que representa una perdida de 2.7%
EN:
Mitsubishi UFJ Financial Group is Japan's largest bank in terms of market capitalization and assets with an 8.9% share of all domestic loans as of June 2020. It is the largest non-Chinese banking group worldwide and has a slightly larger balance sheet than JPMorgan Chase and HSBC Holdings.
Mitsubishi like many other companies in the financial sector has been hit hard by the pandemic. The company's current price is still 17% below its pre-covid price and remains a target for purchase.
Basics:
- Value
- P/B 0.3x VS 1x industry
- 11.3% estimated growth in net earnings for the next 3 years
- ROE 4.4% vs 8.3% industry
Technicians:
- Price level touching SMA 200-100
- Williams R% at -80% levels
- RSI (M) Neutral
- +9% average upside in the last month
After 9% correction at the end of November, we can see stock sells was stopped on a solid support of $4.25 which has been respected since then. Regarding the technical data, the price level is next to the SMA 200-100 and at any moment it could break that trend that could lead us to the 8% target. Consequently we have chosen to mark a stop loss level at the following solid support which represents a 2.7% loss

Mitsubishi UFJ Financial Group (8306 - Tokyo) - ABC wave patternMitsubishi UFJ Financial Group was in 4th wave triangle, which was over. It is in now 5th wave down which is only confirmed when triangle will broken down. This 5th wave is the part of C wave major down in daily time frame as ABC correction down. The better odd for this set up is that it’s under-performer to Nikkei index.

Mitsubishi UFJ Financial Group (8306 - Tokyo) - ABC wave patternMitsubishi UFJ Financial Group is in Y wave down in Daily time frame, which is moving down in ABC down as shown in chart. Impulse A down and B correction was already over. Price is now moving down in C wave. Wave 2 is in progress.

Chart of the Day 3/3: Avoid Banks, this time is differentAs we contemplate the convergence of long-term US rates with that of Europe and Japan as well as the Japanification of the global economy, it is useful think about the potential impact on banks. Yes, low rates are not good for banks and as we have seen in Japan, perpetual low rates does not equate to an increase in velocity of money. That chapter in financial textbooks need to be re-written.
This series of charts will look at the American, European and Japanese banks and this time it is REALLY different. Not in a good way. As you can see, banks are testing long-term post GFC support levels. The key difference is, the last few times the banks tested trend line support, the stocks were oversold. This time, as you can see, banks are overbought on a weekly basis testing long-term trend support.
Whether this is bank-specific or a prelude to the wider trend, the jury is still out. This much I will say, the Americans do not know what they do not know in relation to the Covid-19 situation in the US. For an economy which strength has been measured largely by increases in temporary employment, this is an interesting situation to be in.

MUFJ at buy point. Good upside potential.Currently testing support of potential double bottom high point. Appears to be good risk/reward here.


Long fir while?With trader war in a hole, now breaking a historical volatility we can see a upper mover in medium term!


bullish for a long time chart is on correction and im waiting for breakout and buy position ...
buy after breaking
