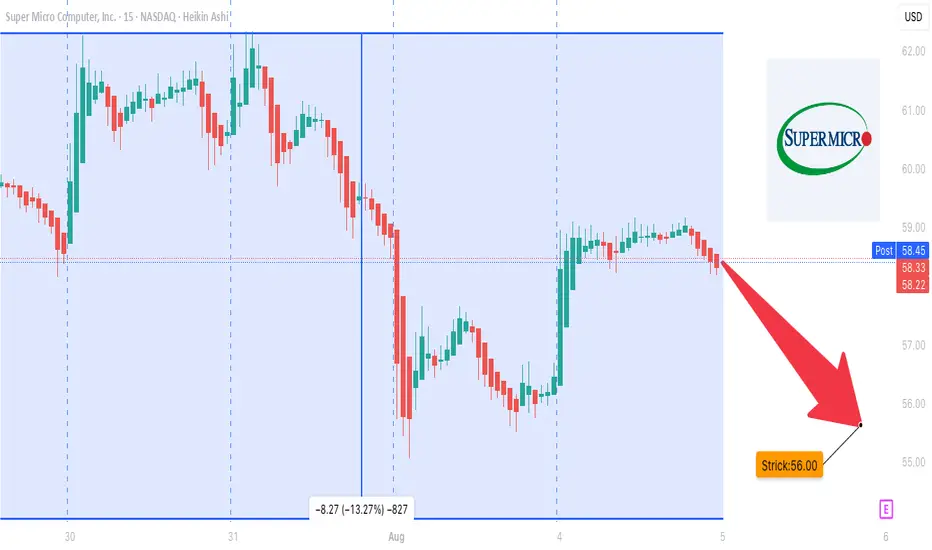
SMCI Earnings Setup: Big Miss Incoming? Put Flow Exploding
### 🧨 SMCI Earnings Setup: Big Miss Incoming? Put Flow Exploding 🚨
📆 **Earnings Date:** Aug 5, 2025 (After Market Close)
💣 **Sentiment:** **Moderate Bearish** — 72% conviction
💬 **Why?**: Weak margins, cash burn, heavy put activity, and bearish technicals.
---
### 🔍 Quick Breakdown:
📉 **Fundamentals:**
* Profit margin only 5.34%
* Free cash flow: **–\$272M**
* Historical EPS beats? Just 50%
* Analyst consensus is turning **bearish**
🧾 **Options Flow:**
* Heavy \$58 & \$56 **Put Accumulation**
* Cautious positioning into earnings
* Skewed toward **defensive hedging**
📉 **Technicals:**
* Weak RSI (\~48), poor volume
* Price drifting with no conviction
* 🔑 Key Support: \$53.66
* 🔼 Resistance: \$60.00
---
### 💼 Trade Setup: SMCI PUT ⚠️
* 📍 **Strike:** \$56.00
* 📆 **Expiry:** Aug 8, 2025
* 💵 **Entry Price:** \$2.23
* 🎯 **Profit Target:** \$6.69
* 🛑 **Stop Loss:** \$1.11
* 🧠 **Size:** 2% Portfolio
**Expected Move:** 10–15% ⚠️ (based on IV and past reactions)
**Exit Plan:** Take profits within 2 hours post-earnings to avoid IV crush!
---
### 📈 TradingView Tags:
```
#SMCI #PutOptions #EarningsPlay #BearishSetup
#OptionsFlow #TechnicalAnalysis #SwingTrade #HighConviction
#NASDAQ #AIStocks #MarketVolatility #DarkPoolData
```
---
### 💬 Hook for Comments:
> SMCI bulls better hope for a miracle… or this earnings could trigger a 15% flush. Are you hedged? 😬
MS51 trade ideas
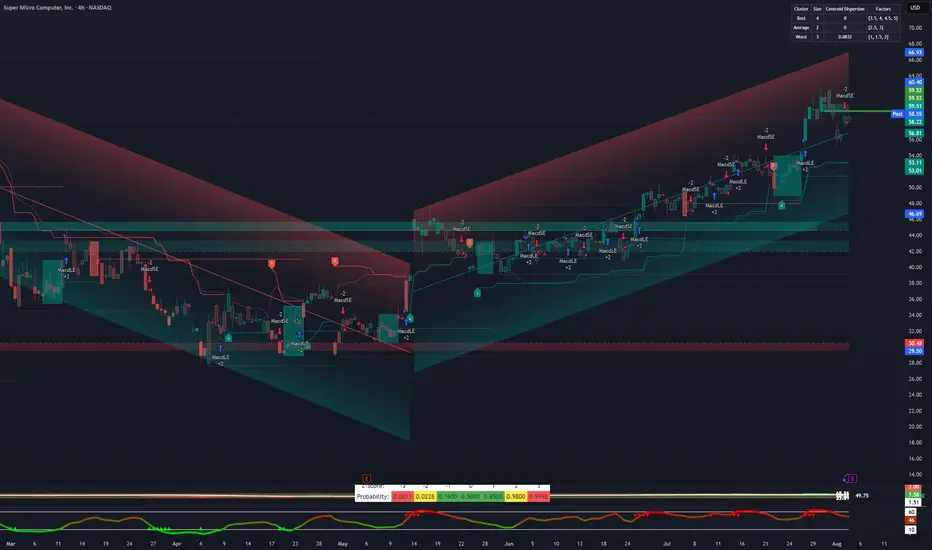
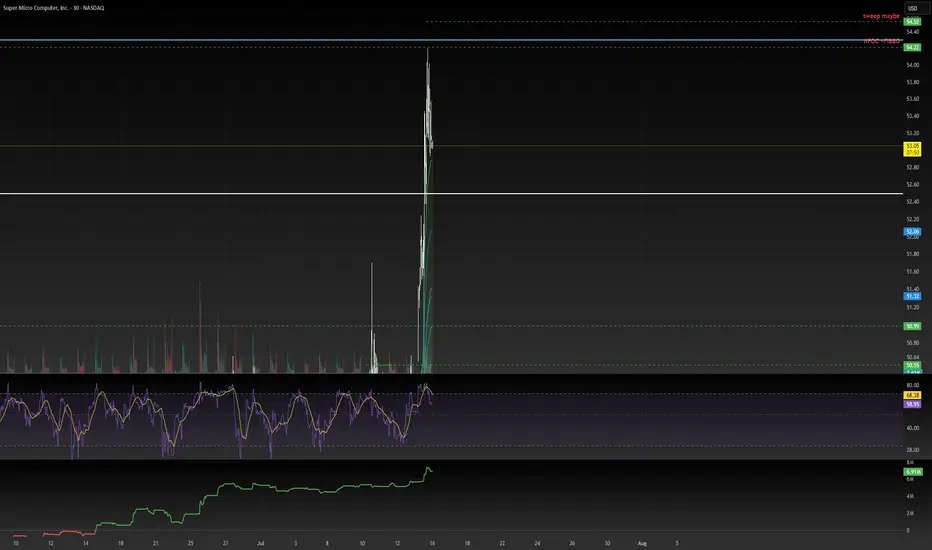
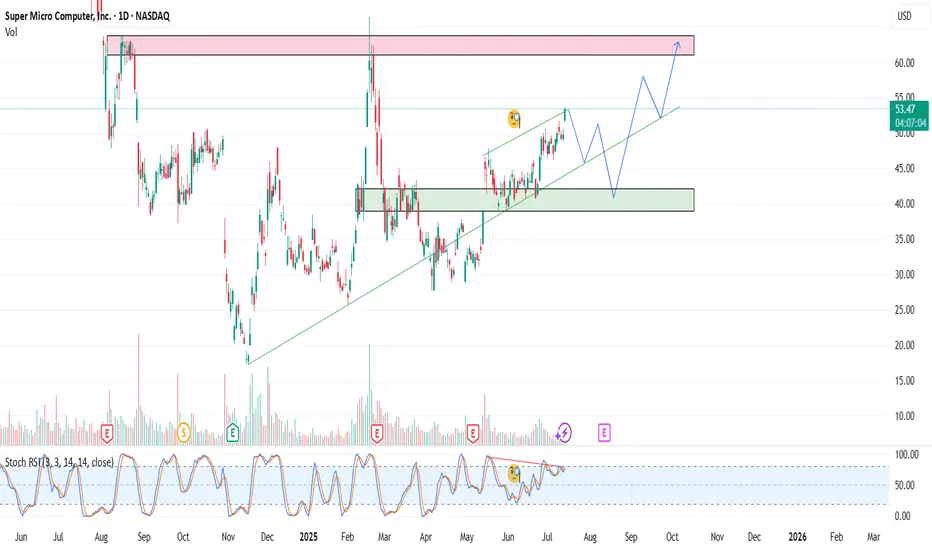
Current situationThings here are about overcoming the new 4-hour resistance from the accumulated volume of $60.40. I think that will happen only after good results tomorrow. Logical, because it clearly did not happen today. And the decline logically came after the SP500 correction, which I wrote about here at the beginning of last week, about which some friends here asked me why I was sure it would happen. It was clear that it would happen and it did, but it started strangely a little before the results of Apple and Amazon, but I will not comment on that here. Ultimately, the price movement is perfect, like in a textbook. We have a breakthrough of the daily resistance of $52.41, which is now a solid support, and then a retest that strengthened this support. The RSI has decreased. In case of bad results, God forbid not tragic ones, we will return there. In case of good results, however, we will reach $72. I have open positions and I think I'll take a risk and, although I don't have any after-market trading for this stock, I'll play for $72+. This is the reality. I don't think I'll give more detailed information on the 5, 15 and 30m levels right now because tomorrow is a special day. I only hope that we don't have a big movement and only a slight drop in the SP500, which I think will be $6358. Good luck!
SMCI – Sell the Spike, Buy the Dip Again?With SMCI approaching a key resistance zone around $64, I'm preparing for a potential pullback. If the price fails to break through that level convincingly, we could see a healthy dip — which I’ll use to re-enter. This is a classic “sell high to buy lower” setup — let the market breathe, then strike.
🟢 Entry Points (Buy the Dip):
$49
$45
$40
🔴 Profit Targets:
✅ $55 – quick bounce zone
✅ $60 – key resistance
✅ $65+ – if momentum continues
📌 Let the chart come to you — don’t chase.
Disclaimer:
This analysis is for educational and informational purposes only and does not constitute financial advice. Always do your own research and evaluate your risk tolerance before making any investment decisions.

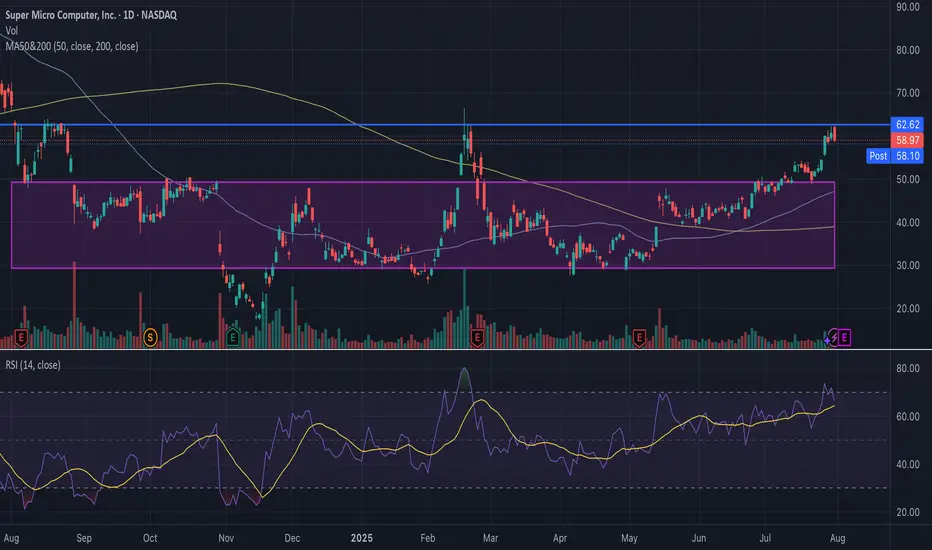
SMCI Short-Term Put PositionSMCI is currently struggling to break past a key historical trend line around $62–$63, a level that acted as resistance multiple times over the past year. The stock briefly broke above $60, but failed to hold the breakout, signaling potential exhaustion. Price is approaching overbought territory with RSI nearing 70. This move is also extended from both the 50-day (blue) and 200-day (yellow) moving averages. Additionally, volume was not exceedingly high during the breakout. I have strong conviction that it will drop to ~50. SMCI spent nearly 9 months trading between ~$33 and ~$50, as shown in the purple consolidation box. If this breakout fails, $50 becomes a natural target, as its the resistance line in the consolidation box where SMCI has been trading at for 9 months. A close below $58 (today’s low) would confirm rejection and likely accelerate selling. A put position could be highly profitable.
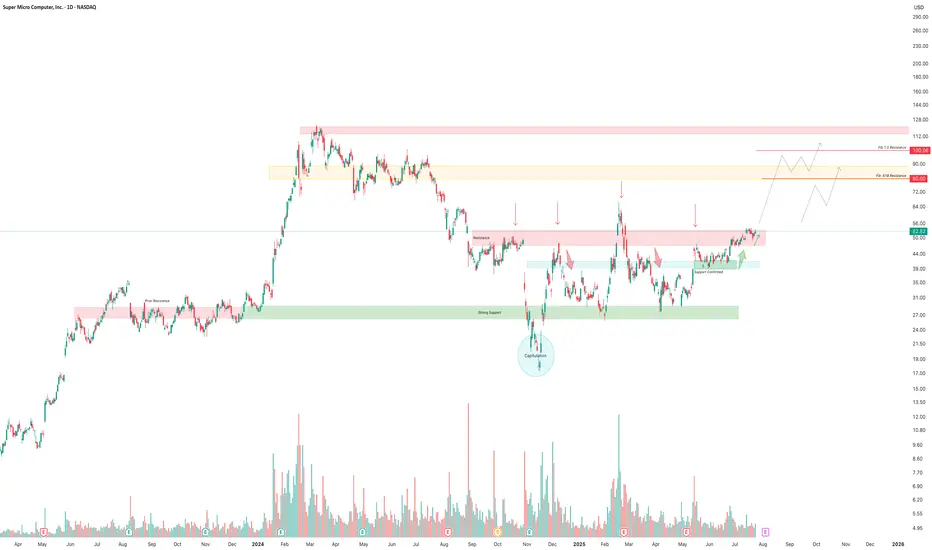
SMCI to Previous Highs!Super Micro Computer Inc. (SMCI) has formed a well-defined accumulation base between $26 and $46 after a major downtrend and capitulation event in late 2024. Price action has since transitioned from panic selling to structured accumulation, confirmed by:
Strong support at $26–28, tested multiple times, creating a clear bottom.
Capitulation low (circled) in November 2024 followed by a swift recovery, indicating institutional absorption.
Break above prior resistance at $47, now acting as confirmed support (light blue zone).
Price is currently pressing into multi-tap resistance near $52–54 — a breakout here would confirm the next leg higher.
Fibonacci extension targets of $80 (0.618) and $100 (1.0) are marked and align with key historical zones.
Volume shows increased interest on green bars during upward pushes, suggesting accumulation rather than distribution.
Summary
SMCI is transitioning from base to breakout with confirmed support and a maturing bullish structure.
A breakout above $54 with volume confirmation could initiate a trend toward the $80–100 zone, backed by technical alignment and renewed AI infrastructure demand.
SMCI WEEKLY CALL SETUP (07/28/25)
### 🔹 SMCI WEEKLY CALL SETUP (07/28/25)
**Bullish Flow + Strong RSI = 🚀 Call Opportunity at \$62**
---
### 📊 TECHNICAL SNAPSHOT
* **RSI (Daily + Weekly):** ✅ Above 55 — clear bullish strength
* **Weekly Close:** 🔼 Broke prior highs — momentum continuation likely
* **Volume Ratio:** Slightly weak (0.9x) 📉 — watch early-week participation
* **VIX:** 14.93 💤 — low vol = smoother price action (great for weekly calls)
---
### 💥 OPTIONS FLOW HIGHLIGHTS
* **Call/Put Ratio:** 4.30 🔥 (heavy bullish skew)
* **Hot Strikes:** \$62.00 & \$63.00 = aggressive positioning
* **OI Surge:** Confirmed institutional interest → upside bets stacking up
---
### ✅ TRADE SETUP
* 🎯 **Strategy:** Long Weekly Call
* 📈 **Strike:** \$62.00
* 📅 **Expiration:** Aug 1, 2025
* 💸 **Entry Price:** \$0.86 (ask)
* 🛑 **Stop Loss:** \$0.43 (50% risk)
* 🎯 **Target:** \$1.20 (40% upside)
* 📈 **Confidence:** 80%
* ⏰ **Entry Timing:** Market open
---
### 🚨 KEY RISKS
* ⚠️ Weak volume = lower conviction from institutions
* 📉 Watch early-week flow → exit if buyers fade
* 🎯 Above \$63 = breakout fuel
* 🧨 Below \$61 = trend in question
---
### 🧠 MODEL CONSENSUS
> All quant models bullish except **one cautioning on volume**
> Options flow + RSI = overwhelming bullish case
---
### 📦 TRADE\_DETAILS (Algo-Friendly JSON)
```json
{
"instrument": "SMCI",
"direction": "call",
"strike": 62.0,
"expiry": "2025-08-01",
"confidence": 0.80,
"profit_target": 1.20,
"stop_loss": 0.43,
"size": 1,
"entry_price": 0.86,
"entry_timing": "open",
"signal_publish_time": "2025-08-01 09:30:00 UTC-04:00"
}
```
---
📈 **Watch zones:**
* 🚀 Above \$63 = breakout
* 🛑 Below \$61 = cut risk
---
**#SMCI #OptionsFlow #CallOptions #WeeklyTrade #RSI #BullishMomentum #MarketOpenSetup #QuantSignals #OptionsAlert**

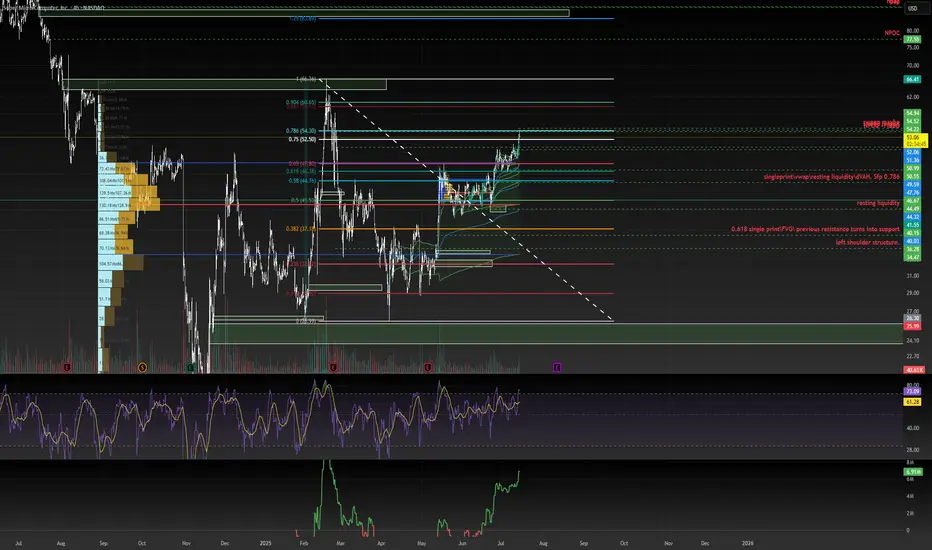
SMCI: When a chart says it’s time to reconnect with the AI hypeOn the daily chart, Super Micro Computer Inc. (SMCI) is showing a clean bullish setup. Price broke out of a descending trendline (green dashed), confirmed it with a retest, and is now consolidating above the breakout zone. The golden cross — where the MA50 crossed above the MA200 — confirms a long-term trend reversal.
Volume profile indicates strong accumulation near $41–43. The 0.5 Fibonacci level at $41.84 acted as support. Above the current range, there’s low volume resistance up to $63.57 (0.786), followed by $66.44 and a final extension target at $79.82 (1.272).
Fundamentals: SMCI is a leading server hardware manufacturer. Demand for their systems has soared with the explosion of AI infrastructure. The company maintains solid financials, with rising quarterly revenue and growing presence in the cloud sector. Institutional investors have been actively increasing their positions since late 2023 — a sign of strong long-term conviction.
Tactical plan:
— Entry: market $42–43
— Target 1: $55.91
— Target 2: $63.57
When technicals scream textbook breakout and fundamentals bring AI momentum to the table — it might just be one of the best late entries in the AI wave this summer.

SMCI is at 60$ USD WE have made it. TXSGanG- 📈 The current price is around $60.11, so it’s very close to the trigger.
- 🧭 Technical indicators (based on TradingView): Moving averages and oscillators are neutral to slightly bullish.
🎯 Sell Zone: $65 to $73 USD
- 🟡 $65: A middle-ground target for those looking to optimize without too much risk.
- 🔴 $73: Ambitious target, marked on your chart with a green arrow. Ideal for more patient investors or those confident in the trend.
🔍 Fundamental Context
- 📉 The stock has seen a sharp correction in recent months, but the current rebound could mark a reversal if confirmed by volume.
🧠 Suggested Strategy
| Price Level | Recommended Action | Emoji |
| $50–60 | Gradual buying / Swing trade | 🛒 |
| $60–65 | Partial profit-taking | 💰 |
| $65–73 | Full exit or trailing stop | 🚀🔚 |
The information and publications are not meant to be, and do not constitute, financial, investment, trading, or other types of advice or recommendations.
Thank you!
Subcribe to TSXGanG! 🧠🎯

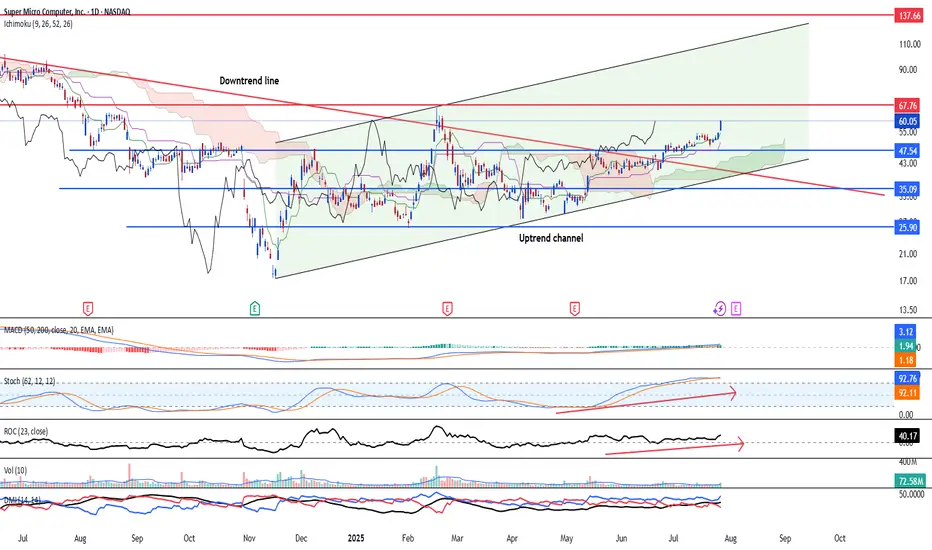
SMCI - Uptrend resumingNASDAQ:SMCI is looking at a return of the uptrend after breaking above its corrective downtrend line and buying pressure is seen resuming. Overall major trend is on the upside and strong.
Momentum:
Long-term MACD: histogram is positive and signal line is rising steadily
Stochastic Oscillator: Nearing overbought zone, but momentum remain healthy. As long as correction (if any) is not strong (drop cannot be more than 7% within a week).
Volume is healthy
Buy spot at 60.05 or buy upon correction at 43.27.
35.09 is the major support.
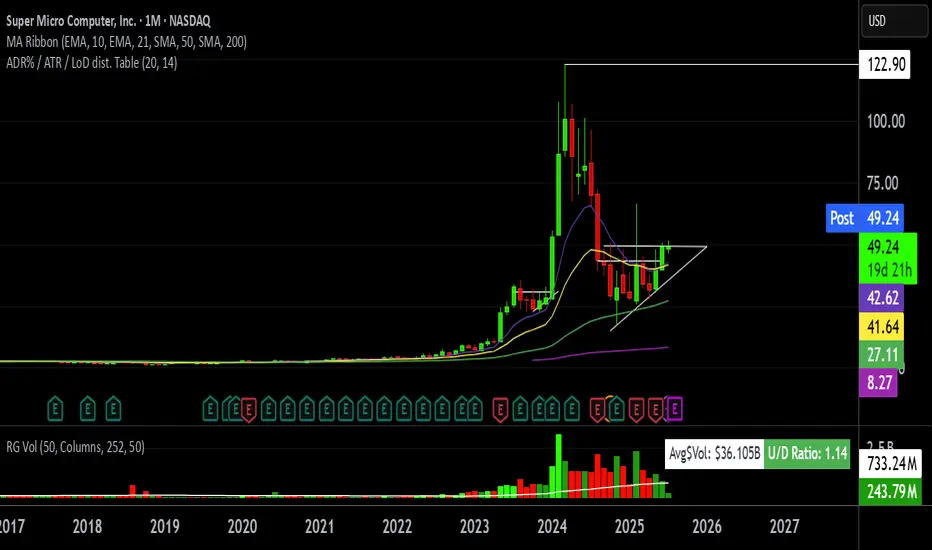
Looking at monthly chart on SCMI I see 3 white soldiers to $100Not that much to describe as the three white soldiers on the monthly candle chart are pretty self explanatory. One of the more basic readings for good times ahead. That’s aside from the fundamentals of having most of the ai data centers using its liquid cooled state of the art chassis’ designed for latest Nvidia chips.

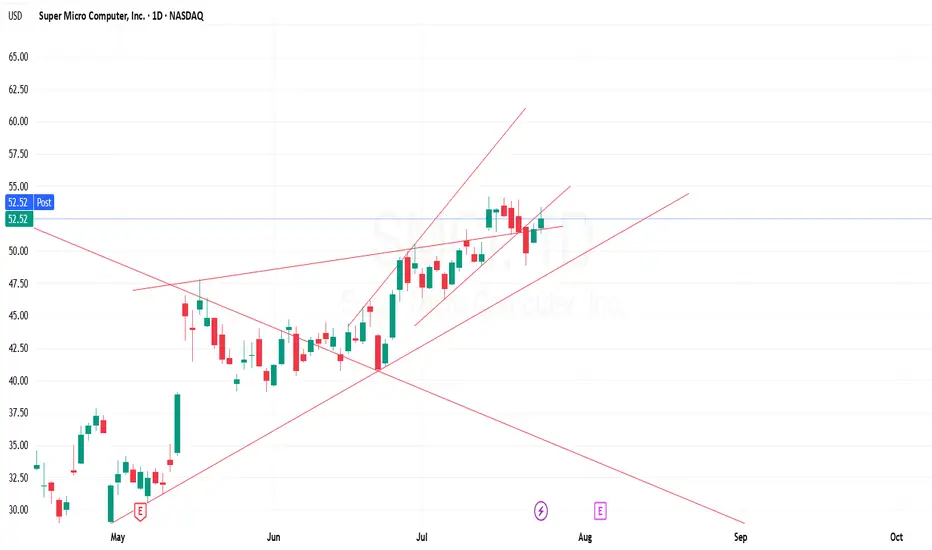
Long Trade Setup on $SMCI!📈
Entry: $54.46
Stop Loss: $53.97
Target: $56.39
Pattern: Rising Wedge Breakout
Risk-Reward: ~2R
Key Zone: $55.41 (resistance/rejection level to watch)

Reversal from Daily Trendline50, 52, 54 sees major resistance. As of today, rejection seen in the daily trend line.
Support 1: 48.90
Support 2: 46.30
Support 3: 35
SMCI going to breakout soon, targeting $200NASDAQ:SMCI hasfound support at $28, it is currently trading around the $46 level. It is attempting to test the $50-$61 range for the third time and will likely turn this level into support with a breakout.
$200 could be a good psychological target. The relative strength against the SP:SPX is about to turn positive in favor of the stock, and I expect volume to increase in the coming days.

NeoWave Structure: Flat–X–Triangle Combination - break outThis chart illustrates a possible NeoWave-style corrective combination: a Flat–X–Triangle structure, likely completed and followed by a breakout.
W Wave: A well-structured Flat correction (labeled A–B–C) with a clean internal 5-wave impulse in C. Balanced time and volume across subcomponents suggest structural completion.
X Wave: A simple, proportionally shallow X connector, in line with NeoWave time and price minimums.
Y Wave: A textbook contracting triangle (labeled a–b–c–d–e), with near-perfect Fibonacci relationships between legs:
• Wave b retraces approximately 61.8% of wave a
• Wave d retraces approximately 78.6% of wave c
• Time symmetry is preserved
• Volume compresses into the apex, a classic triangle behavior
Breakout Observed:
• Price has moved above triangle resistance
• Volume increased at breakout
• MACD shows positive crossover and rising momentum
Interpretation:
This may mark the end of a prolonged corrective structure and the beginning of a new impulsive sequence. Triangle projection targets suggest the $77–80 area as a minimum, with higher Fibonacci extensions possible (e.g., 1.618 or 2.618 of prior moves) if this evolves into a 3rd wave.
Technical Approach:
This analysis follows NeoWave principles (Glenn Neely), emphasizing structural clarity, wave proportion, time-price balance, and breakout behavior.

Got filled at the bugattiMy hedge short is filled
continuation of my other chart
IF this is good the target it the!!....
key levels will be longed if data aligns.
SMCI – Reloading the AI BeastSMCI continues to show strength as a key player in the AI infrastructure space. In this update, I present a new strategy with staggered entry zones at $49, $45, and $38 — designed to capture value during healthy pullbacks within a larger bullish trend.
Entry Plan:
1) $49
2) $45
3) $38
Target:
1) $56
2) $61
3) $66
📉 If price dips back to $45 or $38, I will reload heavier. No FOMO. Let the market come to us.
Drop a 👍 if you're still riding SMCI or waiting for the next entry.
This analysis is for educational and informational purposes only. It does not constitute financial advice or a recommendation to buy or sell any securities. Always do your own research and consider your risk tolerance before making investment decisions.
SMCI: The Monthly Chart says it ALL
Stochastic is way oversold.
MACD is converging.
RSI is converging back up.
Would not be surprised to see this soar back towards the CRT value of $65, then take on new challenges back towards it previous ATH of $122.90 in March, 2024.
Regards,
Terrapins

SMCI: Watching Monitoring price action closely. Momentum remains positive, and volume is supportive of continuation. Awaiting confirmation before entering, but setup favors a potential move higher.

History tends to repeat itselfHistory typically tends to repeat itself. What has happened before can happen again. Take a look at the left side of the chart and you’ll see a picture-perfect breakout pattern: price consolidates, forms higher lows and relatively equal highs, all on high volume, before breaking out. Now, we are witnessing the same setup again on a larger scale. Above is a monthly chart of SMCI, allowing you to compare the similarities between the two breakout formations. What has gone parabolic before can go parabolic again. Earnings will be reported on August 12, which is roughly one month away. If SMCI continues to push higher here, we may see a move toward the all-time high of $122.90. Always do your own due diligence and keep risk management in mind.
Not financial advice.
SMCI BULL FLAG PART 2smci bull flag, reclaimed bullish emas recently, volume starting to come back in, imo has potential to run to 60+

SMCI - Bull Flag Breakout SetupSMCI formed a strong bullish impulse followed by a bull flag pattern.
A breakout above the flag structure may signal continuation if confirmed with strong price action.
Trade Plan:
• Entry: On breakout or retest
• Stop Loss: Below flag support
• TP1: Recent high
• TP2: Measured flagpole extension
This setup is worth monitoring for potential bullish continuation.
Disclaimer: This is not financial advice. For educational purposes only.

SMCI buy cycle in progress into yr endStrong buy rates on order flow indicating buy-side targets as follows
tp1 = 88
tp2 = 96
tp3 = 105
...by end of 2025
Still expecting strong sell wave sometime by mid-2026 all the way back to 20's as the semiconductor space continues dealing with growing bearish forces. Recent weakness should be seen as "shots across the bow" or warning shots. Next set of highs will be opportunities to EXIT and go short imo.
