NFLX Potential for Bullish Rise | 8th February 2023Looking at the H4 chart, my overall bias for NFLX is bullish due to the current price being above the Ichimoku cloud , indicating a bullish market.
Looking for a pullback buy entry at 332.72, where the overlap support and 38.2% Fibonacci line is. Stop loss will be at 273.41, where the recent low is. Take profit will be at 472.02, where the overlap resistance and market gap are.
Any opinions, news, research, analyses, prices, other information, or links to third-party sites contained on this website are provided on an "as-is" basis, as general market commentary, and do not constitute investment advice. The market commentary has not been prepared in accordance with legal requirements designed to promote the independence of investment research, and it is therefore not subject to any prohibition on dealing ahead of dissemination. Although this commentary is not produced by an independent source, FXCM takes all sufficient steps to eliminate or prevent any conflicts of interest arising out of the production and dissemination of this communication. The employees of FXCM commit to acting in the clients' best interests and represent their views without misleading, deceiving, or otherwise impairing the clients' ability to make informed investment decisions. For more information about the FXCM's internal organizational and administrative arrangements for the prevention of conflicts, please refer to the Firms' Managing Conflicts Policy. Please ensure that you read and understand our Full Disclaimer and Liability provision concerning the foregoing Information, which can be accessed on the website.
NFC trade ideas

QuickTrade Idea n.280 # NFLXI am Bullish above $365.84 with target at $373.61
I am Bearish below $355.65 with target at $350.02

Netflix no more password sharing =(Its time to sell netflix as we can no longer share passwords :(
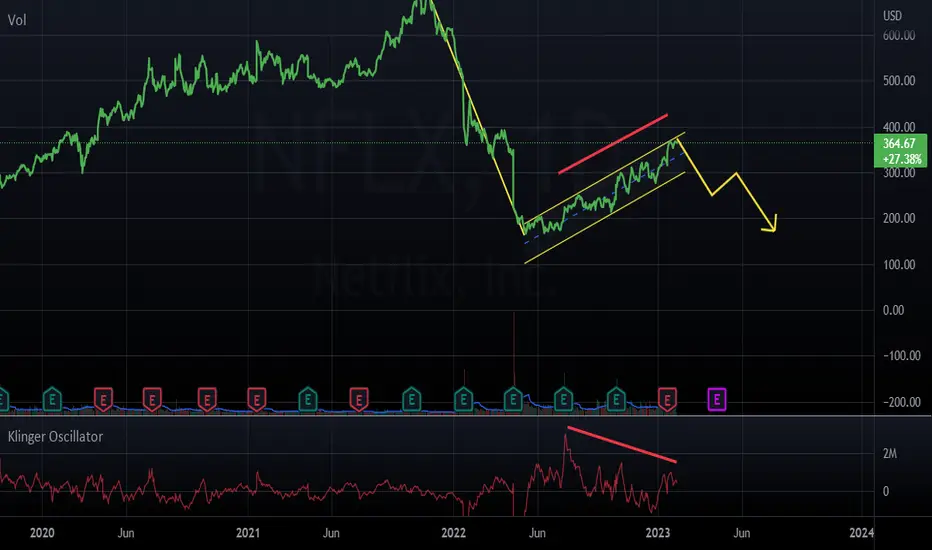
Nothing to do with Bearish Regular divergence on Daily chart
or even a formation of bearish variant flag, that may indiacate a bearish continuation, may be merely coincidental =/
NFLX calls?nflx calls might looking good today. usually people will sell on market open so wait for that and then get in to the calls

NFLX AnalysisPrice reacted a little from the bearish POI at 366.43 from my last analysis. Price is unable to push higher with a strong rejection. I'm expecting price to continue lower with a confirmation on the lower timeframe.

Password Sharing, The Death of Netflix.It's not 2014 Streaming Movies isn't revolutionary anymore. Netflix's days of competing with Block Buster and Red box are long gone. Streaming services like Hulu and Disney+ are taking more market share as the days go on. Unless Netflix can evolve its identity it will just be another streaming service in an overly saturated market. Netflix Accounts are used communally like public toilets, where will this company be in 10 years?

Short NetflixNow that Netflix touched the trendline we should expect the stock to gown a little bit to find support around $322.

Trading Idea 029: NetflixMarket Conditions:
- bullish trend
- bullish sentiment in the market
Key Level and Lines:
- $360.00 support
Trading Ideas:
- go long after consolidation above the support
- go short if the price moves below the support and there is bearish sentiment in the market.

NETFLIX: DON'T FORGETHi guys, i think is stupid remind this, but it's a good advice don't copy other.
Let's see if anyone will understand next time.

Netflix remains positive.Netflix - 30d expiry - We look to Buy at 332.21 (stop at 312.09)
Daily signals are bullish.
There is no clear indication that the upward move is coming to an end.
Previous resistance at 330 now becomes support.
Previous support located at 330.
329.82 has been pivotal.
We look to buy dips.
Our profit targets will be 382.42 and 388.42
Resistance: 368.90 / 380.00 / 396.50
Support: 348.71 / 332.63 / 313.39
Please be advised that the information presented on TradingView is provided to Vantage (‘Vantage Global Limited’, ‘we’) by a third-party provider (‘Signal Centre’). Please be reminded that you are solely responsible for the trading decisions on your account. There is a very high degree of risk involved in trading. Any information and/or content is intended entirely for research, educational and informational purposes only and does not constitute investment or consultation advice or investment strategy. The information is not tailored to the investment needs of any specific person and therefore does not involve a consideration of any of the investment objectives, financial situation or needs of any viewer that may receive it. Kindly also note that past performance is not a reliable indicator of future results. Actual results may differ materially from those anticipated in forward-looking or past performance statements. We assume no liability as to the accuracy or completeness of any of the information and/or content provided herein and the Company cannot be held responsible for any omission, mistake nor for any loss or damage including without limitation to any loss of profit which may arise from reliance on any information supplied by Signal Centre.

Excelsius AI Setup: $NFLXExcelsius AI Setup 👨🚀
Pair: NFLX 🚨
Direction: Neutral 📈📉
Timeframes: Daily 🔍

NFLX continues downside trajectory to wave c ahead of FOMC 2/1This update continues to build upon the idea published on 1/25/23. On 1/26 NFLX showed weakness around $370 as it refused to push higher. The initial short play was further endorsed by the bearish divergence on the hourly RSI below. Right now we expect NFLX to complete this (a,b,c)sequence down to $345 at the least. This should play out right before much anticipated FOMC on 2/1/23 which we have an overall bullish outlook for.
You may tend to see rather bullish pricecaction from the calls that could come in for the smaller b wave tomorrow 1/30
I will not partake in this move up but will rather wait for signs of weakness & rejection back to downside to complete the more aggressive c wave as listed on the chart.
Currently in the $362.50/360 Put Debit Spread Exp 2/3. I may re-enter for less outlay on any bounce up to $355+ tomorrow to target the $348 area for more efficient gain. Example being a $355/$352.50 Put Vertical exp 2/3 or 2/10

$NFLX: Weekly uptrend confirmed$NFLX has flashed a series of weekly uptrends, and in the prior two occurrences, it reached the target really quick, within the first 1-3 bars. With earnings due it could be about to surge higher fast, but of course there's a risk with going long ahead of earnings, I generally don't take trades ahead of earnings unless I'm up YTD. Keep an eye out for continuation here, setup looks solid.
Best of luck!
Cheers,
Ivan Labrie.

NFLX AnalysisPrice did not play out as analyzed last week. Price rallied higher to the main bearish POI at 366.43 and has shown signs of changing of character on the lower timeframe. However, there are also buy-side liquidity being built on the lower timeframe, where price could still continue higher before a confirmation to go lower is given.

NFLX divergenceNFLX has plenty of divergence on MACD and RSI. 325 seems like a respectable target for mid FEB.

$NFLX Heavy Supply Area$NFLX We Just hit old support area which should act as resistance, hit the upper part trendline of channel and downwards trendline, overbought RSI on both Daily and Weekly. High risk for downside from this area

NFLX Technical Playbook for 9/17/21Netflix is currently overbought on the Daily timeframe , stretching out well above the 8 ema . After completing an inverse head & shoulders, there is plenty by buy volume supporting levels above $548+. Also on a daily basis the volume average is increasing steadily since late July. With the overall market currently pausing from all time highs and taking a bit of a nose dive since Thursday, bulls may stave off with a reaction at the 21 day ema as bears attempt to push lower. But With buy volume stronger across the VPVR, EMA’s curving up, and in the Target range of a inverse head & shoulders, pattern I am neutral to bullish this week coming up.

$NFLX setting up for a breakout Since Mid-May 2022
$NFLX hits the low (163)
Mid-June 2022 hit the low (163) support 2nd time
Mid-July 2022 almost hit support (163) 3rd time
Mid-Aug. 2022 hit uptrend resistance at (253)
Mid-October 2022 broke uptrend support at 225 but it defended at 221 level and rebounded
End-of Oct. 2022 hit uptrend resistance (304)
1st wk of Nov. 2022 hit uptrend support ((250)
Mid-Nov 2022 hit uptrend resistance (316)
Mid-Dec. 2022 hit Uptrend resistance (332)
End of Dec. 2022 hit Uptrend support (274)
After Earnings, Jan. 2023 broke uptrend resistance (358)
It took 3 months and tested uptrend resistance level 4 times and broke above at the 5th time.

NFLX High Probability Play NFLX is just finishing off a large 5 wave sequence to the upside. Currently a double top is forming on the hourly with 5 wave left top and B wave right top. This will be followed by a strong C wave down. Pairing Elliot Wave with chart patterns can add compelling conviction and reliable confluence to price action. A, B, C structures are usually also confirmed by average to low volume. NFLX has been trading with average volume since the start of A wave down.
The most likely target for a pullback is between the $355 (23.60%) and $347 (38.20%) range. A psychological resistance of $370 is also in play. I plan to target this with the now “cheaper put premiums) due to lack of real volatility and weak economic calendar. A put debit spread of any combination of strikes between $360 & $352.50 Exp 2/3 would be a sound bet for this downside move. A nice confirmation entry would be a loss of the 34MA on 15 min timeframe and RSI crossing under 50

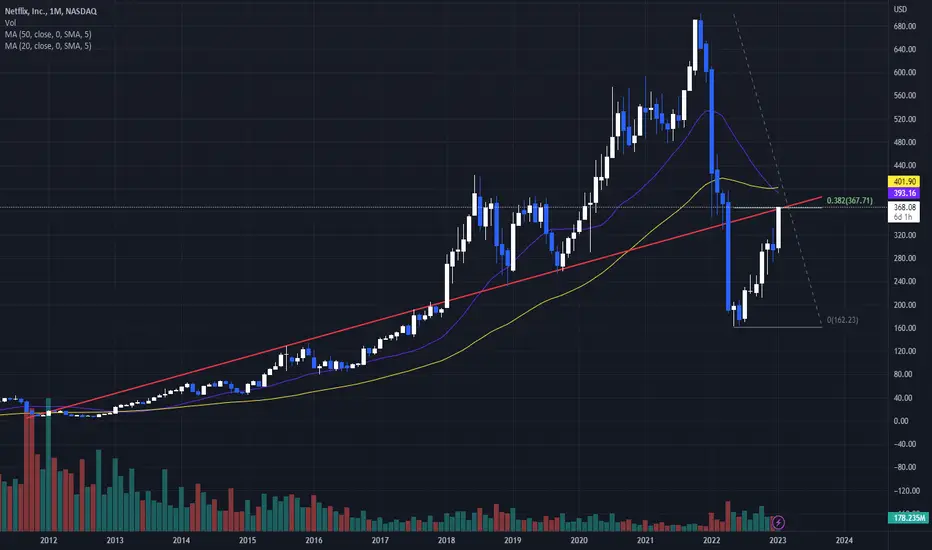
Netflix running into a multiyear trendline!Time to short? I think so. Over extended prices, monthly death cross, multiyear trendline (resistance), and a . 382 retracement all in play.
Good luck!
NFLX - Potential Short Setup Here we are looking at NFLX on the Daily TF…
As you can see, Netflix has broken down from its previous macro support (blue), and retraced back to the scene of the crime. Currently, it is re-testing this very same previous support as newfound resistance.
While I can’t suggest how YOU should trade it, this certainly appears to me as a VERY strong short set up (not financial advice).
We will continue to monitor this chart and see how it reacts to this level. Stay tuned to make sure you don’t miss any timely updates…
What do you think will happen? Let us know in the comments!
Cheers!

NFLX Short 3 factors here, all lining up for a short play. 2 major trend lines and some RSI divergence.

NFLX Potential for Bullish Rise | 25th January 2023Looking at the Daily chart, my overall bias for NFLX is bullish due to the current price being above the Ichimoku cloud, indicating a bullish market.
Looking for a buy entry at 332.72, where the 38.2% Fibonacci line is. Stop loss will be at 273.41, where the recent low is. Take profit will be at 472.02, where the overlap resistance and 61.8% Fibonacci line is.
Any opinions, news, research, analyses, prices, other information, or links to third-party sites contained on this website are provided on an "as-is" basis, as general market commentary, and do not constitute investment advice. The market commentary has not been prepared in accordance with legal requirements designed to promote the independence of investment research, and it is therefore not subject to any prohibition on dealing ahead of dissemination. Although this commentary is not produced by an independent source, FXCM takes all sufficient steps to eliminate or prevent any conflicts of interest arising out of the production and dissemination of this communication. The employees of FXCM commit to acting in the clients' best interests and represent their views without misleading, deceiving, or otherwise impairing the clients' ability to make informed investment decisions. For more information about the FXCM's internal organizational and administrative arrangements for the prevention of conflicts, please refer to the Firms' Managing Conflicts Policy. Please ensure that you read and understand our Full Disclaimer and Liability provision concerning the foregoing Information, which can be accessed on the website.
