NFLX IRON CONDOR Selling FEB IRON CONDOR
1015/1020
750/745
FEB IRON CONDOR
IVR = 78.1
The 1015/1020 FEB Call spread is the last in the option chain that is $5 wide.
Strikes above 1020 are all $20 wide .
NFC trade ideas

NFLX Elliot Wave, Wyckoff Method with Head & Shoulders PatternIt is not always easy to time a short, but looking at this chart I will share a couple of confluences that are interesting from a technical analysis point of view.
First, there is a 5 wave completion of the Elliot Wave pattern.
Then, based on the Wyckoff method of accumulation to distribution, we can gauge areas of UTAD and LPSY takes place.
Lastly, we can form a Head & Shoulders pattern (a small one) and a neckline.
One can carefully enter the short after the break and retest of the trendline, which is the safest way.

NFLX heading down in the New YearShort term bearish on NFLX. Target for Fri 1/3/2025 875.
Entry at or below 895. Stop Loss 896
*will keep my eye on it for Jan as I think an ultimate target may be close to 800. Methodical move down in descending channel.

Netflix Inc. (NFLX) Analysis and Price Projections for 2025Netflix Inc. (NFLX) analysis and Price Projections for 2025 (3-to-5-Month Outlook)
Below is my analysis for each chart with a focus on Elliott Wave patterns, Fibonacci levels, and potential buy-the-dip opportunities.
Netflix Inc. (NFLX)
Current Price: $891.32
Key Levels:
Resistance: $941.75 (Wave 5 high).
Support: $644.16 (38.2% retracement), $460.30 (61.8% retracement).
Outlook: NFLX shows signs of a Wave 5 peak and is likely heading into a deeper correction. Support levels at $644.16 and $460.30 are key areas to watch.
Projection: NFLX could rebound from these levels to test $800-$850 by mid-2025.

Netflix possible Outlook So I was reviewing a few stocks & I saw how much of a major push this has shot up. We might be in for some retracement before continuing to the upside or it might be a hard correction time for Netflix. Curious on how this will play out. We still are in holiday times so stuff won't move too much but I will be keeping an eye on this

Netflix Analysis: Key Levels and Trading Outlook 2024.12.29Hello, this is Greedy All-Day.
Today’s analysis focuses on Netflix (NFLX).
Weekly Chart Analysis
Looking at the weekly chart, Netflix is currently consolidating within the 884–944 range, which represents about a 5% range of sideways movement. This consolidation has lasted for approximately one month.
Since the sharp decline in 2022, Netflix has been following a newly established ascending trendline, which remains intact and shows no signs of breaking.
Key observations:
Netflix has climbed approximately 35% beyond its all-time high in 2021, reaching new highs.
However, the price is now in a consolidation phase, which raises the question: is Netflix preparing for further upside, or is this a period of rest before a potential pullback?
If this sideways movement continues for an extended period, a trendline breakdown may occur. Based on current prices, this breakdown is projected around July 2025.
Weekly Chart with Indicators
When we include indicators such as the 60 EMA, we notice that it aligns closely with the ascending trendline. This alignment increases the reliability of the trendline as a key support level.
However, at this point, entering a new long position appears less attractive due to the following reasons:
Netflix has already risen 35% beyond its previous high of $700, making it difficult to justify additional upside based solely on past data.
Without historical data to support further gains, investors would likely rely on fundamental analysis and the belief that Netflix is undervalued as a company.
Ideal Buy Zones
Where are the best entry points for a buy position?
While Netflix’s current uptrend may suggest continuous growth, corrections are inevitable, even for large companies. Based on this, I’ve identified two potential buy zones marked as blue boxes on the chart:
First Buy Zone: $700
This level was the all-time high in 2021, which now acts as support after being broken to the upside.
Even if the price drops, it’s unlikely to fall below $700 easily, as this level is supported by the ascending trendline from 2022.
Second Buy Zone: $350
The first green box shows a sharp drop followed by a temporary rebound.
The second green box highlights a key support level that held during a previous consolidation phase. Both zones indicate strong support and potential for a bounce.
Reversal and Sell Perspective
The red box zone highlights an area for potential reversal or sell positions.
If Netflix breaks the $700 level and the ascending trendline, it would signal a significant shift toward a bearish trend.
A breakdown below $700 could lead to a sharp decline, with the first buy zone ($700) and second buy zone ($350) representing a potential 50% difference.
This suggests that a trendline breakdown could trigger a substantial bearish reversal, making short positions or hedge strategies worth considering.
Conclusion
While Netflix has demonstrated strong upward momentum, history shows that even the largest companies can experience corrections of 70% or more.
Instead of chasing continuous rallies, it’s crucial to consider both bullish and bearish scenarios and plan trades accordingly.
Let’s make 2025 a successful trading year together. 🚀

#NFLX Projection by end 2026As my analysis shows here, the #NFLX will more likely reach the target of $1160 by the end of 2026. This will be beyond the market average and it's a beat the market situation.
Study more, technical analysis is just the probabilities overview.

Top 5 Weekly Trade Ideas #3 - NFLX Channel BreakThe market is beginning to look a lot more bearish this week IMO, so starting to look at some short setups after only taking longs basically since the election. Wouldn't be surprised if we had a bullish reaction after FOMC and into the end of the year, but expecting downside at this point.
NFLX may be a good candidate for a short, clean channel break and has already failed on a retest once. Don't think I'd short here, maybe on another channel test or ATH test. I'd mainly be looking for puts if it breaks back below $909 and fails on a retest. Final downside target for this one will be a full retracement of the move from where the channel started around $859.

Netflix Is In Process Of Doing Five Waves AdvanceShort Term Elliott Wave view in Netflix ticker symbol: NASDAQ:NFLX suggests that rally from 8.05.2024 low is incomplete & should continue upside. It is showing 3 swing higher since August-2024 low & expect more upside against 11.18.2024 low. It ended 1 at $736 high as diagonal & 2 correction at $669 low. Within 1, it placed ((i)) at $711.33 high, ((ii)) at $660.80 low & ((iii)) at $728 high. Wave ((iv)) ended at $696.43 low & finally ((v)) ended at $736 high as wave 1. Within 2 correction, it placed ((a)) at $699.78 low, ((b)) at $710.24 high & ((c)) at $669 low near 50% Fibonacci retracement of 1.
Above 2 low, it favors upside in wave 3 in another 5 waves impulse sequence. Whereas wave ((i)) ended at $773 high, wave ((ii)) ended at $744.26 low. Wave ((iii)) ended at $841 high, wave ((iv)) ended at $804.30 low and wave ((v)) at $941.75 high. Below from there, the stock made a pullback in wave 4 to correct the cycle from 10.17.2024 low. The internals of that pullback unfolded as Elliott wave double three structure where wave ((w)) ended at $909.61 low in a lesser degree 3 waves.
A bounce to $928.94 high ended wave ((x)) and started the ((y)) leg lower towards $896.73- $876.79 blue box area where buyers were expected to appear. Since then the stock has reacted higher from the blue box area allowed longs to get into a risk free position. Therefore ended wave 4 pullback at $881.01 within the blue box area. Near-term, as far as dips remain above $881.01 low and more importantly above $804.46 low the stock is expected to resume the upside in wave 5. For minimum extension target towards $956.38- $979.68 area higher (inverse 123.6%- 161.8% Fib extension of wave 4). Before ending the cycle from 8.05.2024 low in 5 waves advance & making a pullback.

Netflix to $1,100 ?With Christmas around the corner, Netflix (NASDAQ: NFLX) is set to benefit from increased streaming as families worldwide spend more time indoors during the holidays. This seasonal trend, coupled with Netflix’s rich content library and holiday-themed releases, positions the platform for significant engagement and subscriber growth.
The stock recently closed at $909.74, and analysts at TipRanks have set an optimistic target of $1,100 per share. With increased global streaming hours and strong content strategies, Netflix is well-positioned to ride the holiday momentum. Investors should watch Q4 subscriber growth for further insights into this upward trend.

867 or close is clear direction bearish short term The downward movement started but stopped in the last session; based on the sentiment of the individual ticker, movement can be seen to the upside, but not in the short term. I believe a mid to high 800 test is a solid retracement and a substantial area to buy.


NFLX, BE CAREFUL HERE GUYS Netflix has been on a great run for a while now. It’s getting very close to a major correction that will come over the coming weeks and months ahead. Just based off a few things here in this simple 2 week chart we have a major trend line where price gets rejected every time we hit it. All major time frames are over heated. Volume has been falling for quite some time now as prices have been on a steady climb. It’s basically telling us that mostly retail and smaller players have been pushing these prices up lately.
Nothing goes up forever guys. Be extremely cautious at these levels. The probabilities of a 25% plus correction from here are high.
Be rational and play it safe. God bless

NFLX pullback to $803MODs have suggested that I provide more detail about the picks I make.
Sorry. I'm not as verbose as y'all, and I don't like things to be complicated.
My trading plan is very simple.
I buy or sell at top & bottom of parallel channels.
I confirm when price hits Fibonacci levels.
So...
Here's why I'm picking this symbol to do the thing.
Price at top of channels (period 100 52 39 & 26)
Stochastic Momentum Index (SMI) at overbought level
VBSM is positive
Price at 4.618 Fibonacci level
Down from $876.75
Target is $803 or channel bottom
will manually stop loss

BUY NETFLIXJust an idea and trade at your own risk.
Netflix looking bullish on its weekly timeframe and still in uptrend channel.
After testing the lower of the uptrend channel at area 150, uptrend is resuming and possibly to the upper channel of the uptrend.

NFLX Long TRADE PLAN
NFLX Long
IF
1hr uptrend if price retraces for correction down to 913.71
THEN
I will get in with 10 Shares and manage the trade to get a 4:1 and manage the trade for a potential 9:1

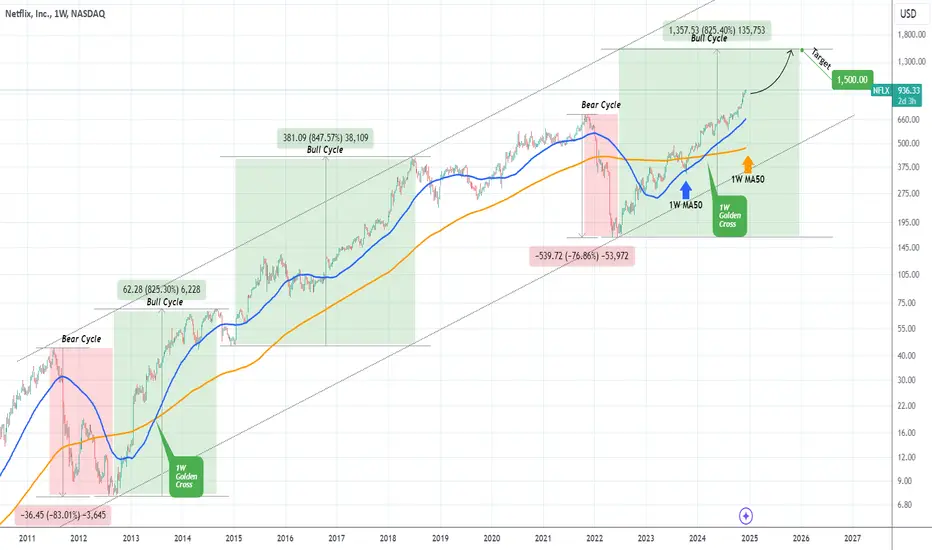
NETFLIX historic pattern targets $1500 in 2025.Last time we looked at Netflix (NFLX) was on its earnings release (October 21, see chart below), when we gave a strong bullish signal that easily hit our $840.00 Target:
Since 3 week ago, the price even broke above the dominant 1-year Channel Up and is now in search of a new pattern. This pattern can be found if we zoom out considerably on the 1W time-frame, where the underlying pattern since the U.S. Housing Crisis is a 25-year Channel Up.
The symmetry within this pattern is high and in fact since the June 2022 market bottom (which was a Higher Low on the Channel Up), the stock has been on a Bull Cycle. The Bear Cycle that preceded it had a massive decline of -77%. The last correction of this magnitude was the July 2011 - August 2012 Bear Cycle, which declined by -83%.
The two Bull Cycles that followed Netflix's golden years were identical (+825% and +847%). As a result, we assume that the current Bull Cycle will also rise by at least +825% from its bottom, which gives us a $1500 Target towards the end of 2025.
Notice also how both the 2012 - 2014 and 2022 - 2024 Bull Cycles had a 1W Golden Cross.
-------------------------------------------------------------------------------
** Please LIKE 👍, FOLLOW ✅, SHARE 🙌 and COMMENT ✍ if you enjoy this idea! Also share your ideas and charts in the comments section below! This is best way to keep it relevant, support us, keep the content here free and allow the idea to reach as many people as possible. **
-------------------------------------------------------------------------------
💸💸💸💸💸💸
👇 👇 👇 👇 👇 👇
NFLX SHORTnetflix is currently kissing a resistance trend from the previous peak, could go as high as 950 but should go down and retest the breakout level around the 50ma

Classic Elliot Wave Reversal?NFLX is on my short radar and given today's pullback candle after a divergent 3rd wave up. I'm expecting further pullback on any weakness in the market this week; perhaps after a bad inflation data.
Looking for a drive below $900 and lower ultimately around $865 region in the coming week(s).

Netflix - Please Buy This All Time High!Netflix ( NASDAQ:NFLX ) will retest the resistance trendline:
Click chart above to see the detailed analysis👆🏻
Netflix is currently perfectly breaking above the previous all time high and with a +16% candle of November, bulls are totally in control of this stock. If we look at previous cycles, there is a 100% chance that Netflix will now retest the upper resistance trendline of the reverse triangle.
Levels to watch: $1.200
Keep your long term vision,
Philip (BasicTrading)

$NFLX Farewell , I bid the adeiu It was a nice ride I'm sure. But it's time to go back down now. RSI hitting resistance on the monthly. Daily exhausted with 7 green days in a row , with a doji to top it off. I would love a gap up and touch of the highs, then flush!! 3 days of red incoming. Monthlies can pay well 💬

From Our Previous NFLX OutlookNetflix moved exactly as how we had projected it some months ago! And still expected to pick up some new heights for atleast few months next!

$NFLX Strong Mover - Potential All Time HighNetflix has been a stronger mover, watching for breakout above the $903.65 strong sell price to target $907.95+ (ATH).
If we start to see weakness I'd like to look for a short below wedge support & the $892 demand zone to target $884.11 - $874.52.
