Short Condor Idea for 10/21 ExpirationNOC- Short Iron Condor Trade Idea:
Expiration Oct 21st (73 Days (an eternity...)).
Strike Prices to create IC:
Long Call: $545.
Short Call: $540.
------
Short Put: $400.
Long Put: $395.
Filled @ $100 ($1.00) credit (as of 8/9 not long after open).
$500 Collateral.
Risk:Reward Ratio: $400:$100, or 4:1.
Short strikes can accommodate approx. 16% down and 13% up from current price (8/9 mid-day).
Good luck trading!
NTH trade ideas

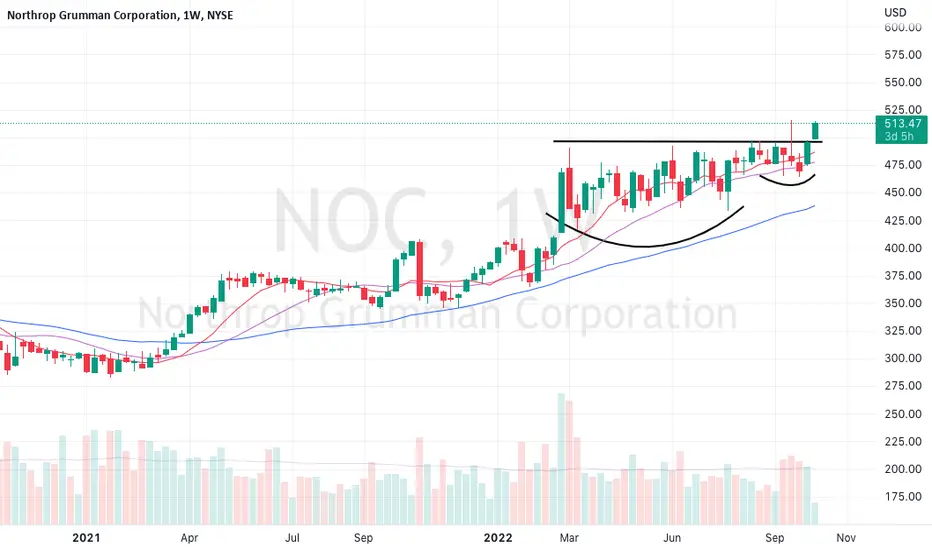
Northrop Grumman Relative StrengthHow's this for relative strength?
$NOC out of tight base to new highs
Has Broken out of Rectangle/Rising Wedge/RSI DiversionAlso a bearish DIVERSION on RSI.
Price is over the bands but not overbought on RSI.
Price is also in a bearish rising wedge. It is not valid as the bottom trendline has not been broken.
No recommendation/Be safe.
Don't lose your shadow (o:

Northrop Grumman CorporationNorthrop Grumman Corporation is a global aerospace and defense company. The Company operates through four segments: Aeronautics Systems, Defense Systems, Mission Systems, and Space Systems.
Over the past 5 months, price has formed an ascending triangle chart pattern with the horizontal boundary acting as strong resistance around the $490.00 level. A daily close above the $497.00 level will confirm the breakout from the 5-month-long ascending triangle with the possible chart pattern price target around the $557.00 level.

Putin orders partial mobilisation of troops on Fed dayPutin orders partial mobilisation of troops on Fed day. Volatility on top of volatility. Defense stock $NOC looks primed to breakout after a long period of consolidation. Broke out from 4 month flag in Aug, and recently consolidating for a month.


RectangleNeutral pattern until a trendline is broken with a confirmed trend in that direction.
Spinning top (candle of indecision) is hanging on the top trendline.
The 20 has crossed up and through the 50 DMA.
No recommendation

NOC - BullflagNOC has formed a bullflag above a break out of a large ascending triangle
This bullflag will likely lead to further continuation upwards


Hypersonic Rocket to the moon: NOCNOC has been consolidating below the 490$ resistance since march.
Technical Indicators are nowhere near overbought, while price action contracted.
Once it expands, there could be a massive pop upwards, since fundamentally there are just too many good things to ignore.
Stock looks like a prototypical William O‘Neill break out candidate.
I‘m long.
No financial advice.

NOC - Bullish WedgeNOC has climbed bullishly out of this rising wedge structure
Green bars pattern placed as an idea of where I think price will move

NOC ShortI wanted to post this yesterday, there is still time though.
I can point out the double top, I can point out the huge divergence, or how the market is overbought...
However on June 6th, a ton of financial media companies such as investors.com were saying this was a solid buy.
This is the prime example of why the "news" or any other FA is not in my trading.
They convince the masses to buy at all time highs and ruin peoples finances.
Yes, we all know, eventually things recover... it's just the simple fact that they're telling people to buy the top that makes me on rely on TA.
This strategy has proven to work for me. Ditch the news, the influences, the brokers, and grind. Learn the charts, reacted to your targets, if you have to wait a day, a month, a year to make a trade, do it... as long as it follows your plan and your plan alone.
Just my humble opinion.

NOC showing very nice VCP characteristics, tight stopEntry with a super tight stop close to the danger point of making an outside day. A tight stop and the liquidity of this stock gives the opportunity to go bigger on size.
Avg Cost: 461.06
Bought: 18K
Risk: 150 USDs
Risk: .92%

NOC New All Time Highs Soon?NOC getting closer to a breakout
12 Weeks Long Base
Making Higher Lows
Showing Great Relative Strength
Institutional Ownership: 84%
Measured Target: 540

$NOC with a Bullish outlook following its earnings #Stocks The PEAD projected a Bullish outlook for $NOC after a Negative over reaction following its earnings release placing the stock in drift C with an expected accuracy of 75%.

$NOC with a Bullish outlook following its earnings #Stocks The PEAD projected a Bullish outlook for $NOC after a Negative Under reaction following its earnings release placing the stock in drift D with an expected accuracy of 66.67%.

Investing opportunity Northcop Grumman Corporation
As you can see, this company is on all-time high, we have a strong demamd zone on the daily timeframe.
This buying opportunity is a high quality setup. And it has a high probability to hit the take profit.

cant see this going much higher 👀NOC looks like a triple top off rsi resistance, looking for a dip to 410 area before we see the next rally on this one.
like and follow for more! ❤

ABC BullishPossible stop under C or recent pocket pivot.
NOC broke the resistance of the prior gap down. More resistance overhead at tops of long candle wicks. There is a long legged doji and 2 shooting stars up there.
The bottom of today's candle is sitting on the 50 SMA/orange. Longer term moving averages are sloping up. The 20 needs some work/blue/and is sloping down and trying to cut down through the 50. Moving averages are lagging indicators.
William's alligator which is comprised of shorter term moving averages is pointing up and is becoming untangled.
Larger white numbers are targets one and the smaller are targets 2. Targets 2 are longer term and may or may not be reached. It is also possible targets one will not be reached as all one can do is make an educated guess. This chart is just an observation and not a recommendation. I wish I knew for sure (o:
NOC is not oversold of overbought on RSI. CMF is positive. Short percent is under 1%.
LMT is in a cup and handle pattern with long entry at 397.10 and targets are 424.60 and 442.
"The investor’s chief problem – and even his worst enemy – is likely to be himself." ~ Benjamin Graham

NOC - LONGERTLike this a lot. If we can hold the blue range I think its possible it finally begins its move out of the consolidation its been in for a long time. When it leaves it will LEAVE

I expect more downside short term, potential bounce off support✅NOC recently tried breaking extreme resistance twice and created a double top formation in the process, unless we break back above resistance a test of 344.16 is very likely in the near future.
also pay attention RSI! its about to break below local RSI support which is not a good sign for longs. Like and follow for more 💘

