NVDA📊 NVIDIA (NVDA) – Daily Chart Technical Analysis
Entry Point:
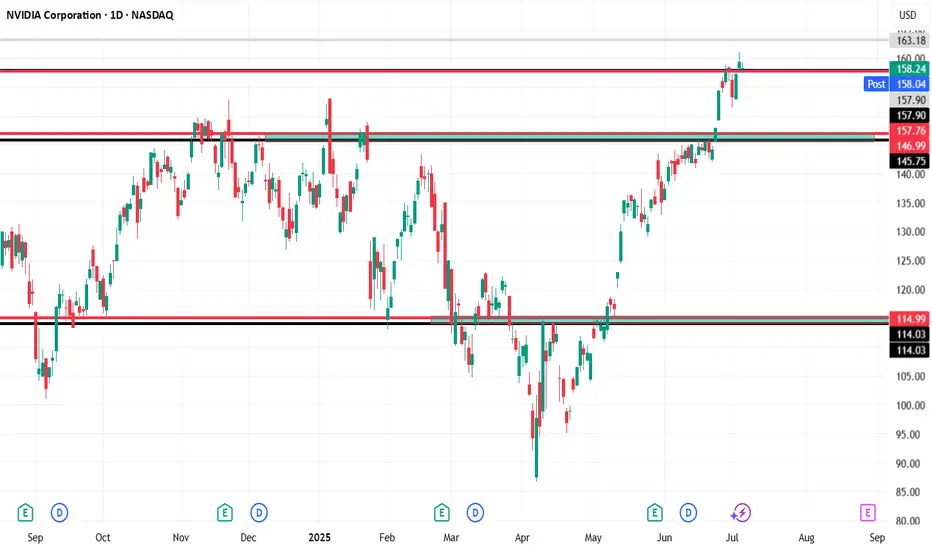
A long position is considered at $158, assuming the price holds above $157.78.
Resistance & Target:
The first target is set at $163, which is a clear resistance zone on the chart based on historical price reactions.
If momentum continues beyond that, higher targets could be considered in future analysis.
Stop Loss:
A tight stop-loss is placed just below key support at $157 to manage risk.
🔄 Weekly Bearish Scenario:
If the price closes below $157, this invalidates the bullish setup:
The first downside target would be $146, which is a previously established support zone.
A further drop could extend toward $115, especially if broader market weakness or sector rotation occurs.
📌 Key Technical Zones:
Support Zones: $157.78, $157.00 (critical for bullish continuation)
Resistance Zones: $158.12, $163.18
Multiple historical rejections and price consolidations are noted near these zones, highlighting their significance.
Summary:
As long as NVDA remains above $157.78, the outlook remains bullish targeting $163. However, a confirmed breakdown below $157 could shift the sentiment sharply bearish, targeting $146 and possibly $115.
NVD trade ideas
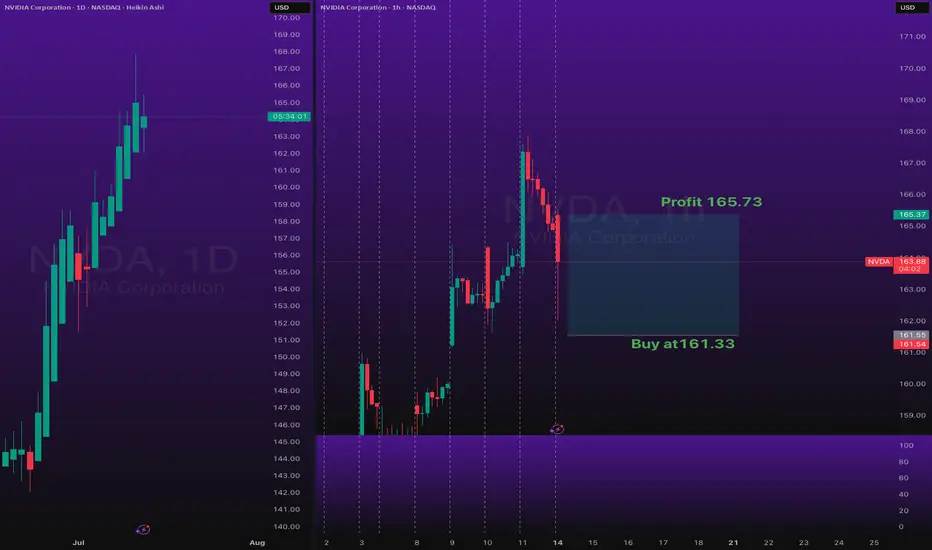
Stocks SPOT ACCOUNT: NVDA stocks Buy Trade with Take ProfitStocks SPOT ACCOUNT: NASDAQ:NVDA stocks my buy trade with take profit.
This is my SPOT Accounts for Stocks Portfolio.
Trade shows my Buying and Take Profit Level.
Spot account doesn't need SL because its stocks buying account.
Nvidia (NVDA) 2025+ Catalysts & Risks: Analyst Views🚀 Nvidia (NVDA) 2025+ Catalysts & Risks: Analyst Views
🔑 Key Catalysts Driving Nvidia’s Stock Growth (2025+)
1. 🏆 AI Chip Dominance
Nvidia maintains >90% market share in data-center AI chips (Blackwell, Hopper, Rubin). Its CUDA ecosystem and relentless innovation keep it as the “default” supplier for advanced AI, giving NVDA massive pricing power.
2. 🏗️ Surging Data Center Demand
Cloud and enterprise AI spending remains white-hot. Tech giants (Meta, Microsoft, Amazon, Google) are collectively pouring $300B+ into 2025 AI CapEx. Data center revenues are at all-time highs; analysts expect this uptrend to extend through 2026 as “AI infrastructure arms race” persists.
3. 🌐 Mainstream AI Adoption
AI is now integrated in nearly every industry—healthcare, finance, logistics, manufacturing, retail. As companies embed AI at scale, NVDA’s hardware/software sales rise, with “AI everywhere” tailwinds supporting 15–25% annual growth.
4. 🤝 Strategic Partnerships
Big wins: Deals with Snowflake, ServiceNow, and massive sovereign/international AI collaborations (e.g., $B+ Saudi Arabia/“Humain” order for Blackwell superchips; UAE, India, and Southeast Asia ramping up AI infrastructure using Nvidia).
5. 🚗 Automotive/Autonomous Vehicles
NVDA’s automotive AI segment is now its fastest-growing “new” business line, powering next-gen vehicles (Jaguar Land Rover, Mercedes, BYD, NIO, Lucid) and expected to surpass $1B+ annual run rate by late 2025.
6. 🧑💻 Expanding Software Ecosystem
Nvidia’s “full stack” software (CUDA, AI Enterprise, DGX Cloud) is now a sticky, recurring-revenue engine. Over 4M devs are building on Nvidia’s AI SDKs. Enterprise AI subscriptions add high-margin growth on top of hardware.
7. 🌎 Omniverse & Digital Twins
Industrial metaverse and simulation/digital twin momentum is building (major partnerships with Ansys, Siemens, SAP, Schneider Electric). Omniverse becoming the industry standard for 3D AI/simulation, unlocking new GPU/software demand.
8. 🛠️ Relentless Innovation
Blackwell Ultra GPUs debuting in late 2025, “Rubin” architecture in 2026. Fast-paced, aggressive product roadmap sustains Nvidia’s tech lead and triggers constant upgrade cycles for data centers and cloud providers.
9. 📦 Full-Stack Platform Expansion
Grace CPUs, BlueField DPUs, and Spectrum-X networking mean Nvidia is now a “one-stop shop” for AI infrastructure—capturing more value per system and displacing legacy CPU/network vendors.
10. 🌏 Global AI Infrastructure Buildout
Recent US export rule rollbacks are a huge tailwind, opening up new high-volume markets (Middle East, India, LatAm). Nvidia remains the “go-to” AI chip supplier for sovereign and enterprise supercomputers outside the US, supporting continued global growth.
________________________________________
📈 Latest Analyst Recommendations (July 2025)
•Street Consensus: Overwhelmingly bullish—~85% of analysts rate NVDA as “Buy/Overweight” (rest “Hold”), with target prices often in the $140–$165 range (post-split, as applicable).
•Target Price Range: Median 12-month PT: $150–$160 (representing ~20% upside from July 2025 levels).
•Key Bullish Arguments: Unmatched AI chip lead, accelerating enterprise AI adoption, deep software moat, and a robust international/sovereign AI order pipeline.
•Cautious/Bearish Notes: Valuation premium (45–50x P/E), high expectations priced in, geopolitical and supply chain risks.
________________________________________
⚠️ Key Negative Drivers & Risks
1. 🇨🇳 US–China Tech War / Chip Export Restrictions
• US restrictions: While the Biden administration eased some export bans in May 2025 (allowing more AI chip exports to Gulf/Asia partners), China remains subject to severe curbs on advanced NVDA AI chips.
• Workarounds: Nvidia is selling modified “China-compliant” chips (H20, L20, A800/H800), but at lower margins and lower performance.
• Risk: If US tightens controls again (post-election), China sales could fall further. Chinese firms (Huawei, SMIC, Biren) are also racing to build their own AI chips—posing long-term competitive risk.
2. 🏛️ Political/Regulatory Risk
• Election year: A US policy shift (e.g., harder tech stance after Nov 2025 election) could re-restrict exports, limit new markets, or disrupt supply chains (especially TSMC foundry reliance).
3. 🏷️ Valuation Risk
• NVDA trades at a substantial premium to tech/semiconductor peers (45–50x fwd earnings). Any AI “spending pause” or earnings miss could trigger sharp volatility.
4. 🏭 Supply Chain & Capacity Constraints
• As AI chip demand soars, there’s ongoing risk of supply/delivery bottlenecks (memory, HBM, advanced packaging), which could cap near-term revenue upside.
5. 🏁 Competitive Threats
• AMD, Intel, and custom in-house AI chips (by Google, Amazon, Microsoft, Tesla, etc.) are scaling up fast. Loss of a hyperscaler account or a successful open-source software alternative (vs CUDA) could erode Nvidia’s dominance.
6. 💵 Customer Concentration
• A small handful of cloud giants account for >35% of revenue. Delays or pullbacks in their AI spending would materially impact results.
________________________________________
📝 Summary Outlook (July 2025):
Nvidia’s AI chip monopoly, software moat, and global AI arms race create a powerful multi-year growth setup, but the stock’s high valuation and US-China chip tension are real risks. Analyst consensus remains strongly positive, with most seeing more upside as data-center and enterprise AI demand persists—but with increased focus on geopolitical headlines and potential supply chain hiccups.
________________________________________

NVDA GEX Options Sentiment Analysis for July 14🧠 GEX Breakdown
* Key Gamma Resistance (Call Wall):
* $164.94 → Highest NET positive GEX (Gamma Wall) – Major resistance where market makers start hedging against further upside.
* $167.89 (local high) → aligns with 1st rejection wick.
* $170 → 2nd CALL Wall (67.29%) – max squeeze potential if $165 breaks with volume.
* Call Side Build-up:
* $167 – 20.62%
* $170 – 67.29%
Stacked CALL walls above = gamma trap if breached, but tough resistance ahead.
* Put Support Walls:
* $152.50 – Strongest downside gamma support
* $148–149 – Layered 2nd/3rd PUT Wall zone
📊 Options Flow Insights
* IVR: 5.6 (very low) → cheap premiums, low expected move
* IVX avg: 44.1
* Call/Put Bias:
* Calls: 11.8% dominance
* GEX Sentiment: ⚠️ Bearish Reversal Risk (high call saturation at resistance)
✅ Suggested Option Plays (Based on GEX Only)
🔸Bearish Rejection Play
* If NVDA rejects $164.94–$165.20 zone (Gamma + Supply confluence):
* Buy puts targeting $160 or $158
* Trade idea:
* Buy: NVDA 160p (Jul 19 expiry or same week)
* Entry: If price stalls/rejects $164.90–$165.20
* Target: $161 → $158
* Stop: Close above $166.00
🔸Bullish Gamma Squeeze (Only if $165 Breaks Cleanly)
* If price breaks and holds above $165.50 with strength
* Buy calls targeting $170 (2nd CALL Wall)
* Trade idea:
* Buy: NVDA 170c (Jul 19 or 26 expiry)
* Entry: $165.60+ breakout + strong volume
* Target: $169–$170
* Stop: Below $163.80
🕯 1-Hour Chart – Price Action Analysis
Market Structure
* CHoCH → BOS → BOS → creating a clear bullish leg, but current supply box at $165 is rejecting price short term.
* Trendline support: Still holding from July 8 lows
* Liquidity zone: $160.96–$161.10 (first demand zone)
Current Setup
* Price is hovering under supply zone + GEX wall → indicating indecision or potential short-term top
* MACD weakening + volume declining = possible pause or reversal
* Clean higher-low structure still intact for now
🎯 Trade Plan Based on 1H Chart
🟢 Bullish Intraday Plan
* Entry: $161.00–$160.50 demand block
* Confirmation: Bullish engulfing or rejection wick
* Target: $164.94 then $167
* Stop-loss: Below $159.80
🔴 Bearish Intraday Plan
* Entry: $164.90–$165.20 inside supply
* Confirmation: Weakening candle (doji or long wick) + no breakout
* Target: $161.00 then $158.80
* Stop-loss: Above $166.10
✍️ My Thoughts
NVDA is coiling just under a heavy GEX resistance wall. If $165 can't break, downside correction to $161–$158 is probable. GEX suggests sellers may be in control unless bulls force a gamma squeeze over $165. Stay patient — let the levels react.
This breakdown is for educational purposes only and not financial advice. Always manage your risk.

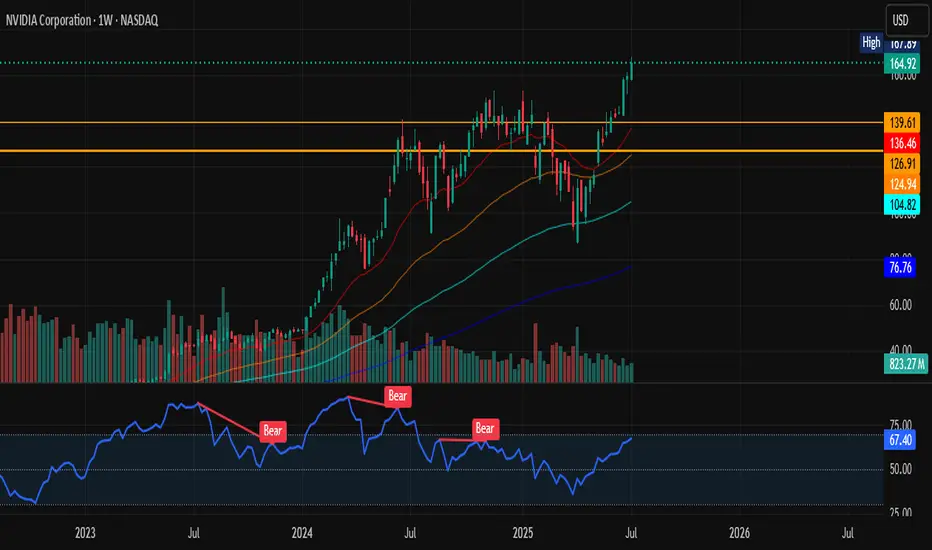
NVIDIA Technical Breakdown NASDAQ:NVDA has broken above the previous congestion/resistance zone (~$139–$145). This zone was tested multiple times and now acts as a support base.
Volume on the breakout week is strong and supporting the move.
Weekly RSI is 67.40, approaching overbought but NOT YET overheated (no bearish divergence). RSI broke past prior Bear zones, signaling renewed strength. Only time will tell.
All-time high territory so proceed with caution. Always due YOUR OWN research.
Bullish long-term trend intact as price is above all EMAs (not too shabby).
I wouldn't be surprised for a pull back soon; maybe 145ish.
Happy Sunday ya'll!
**As always: this isn't financial advice. Please seek professionals on any investments.

NVDA Daily Chart – Rising Wedge Alert!Just analyzed this NVDA setup. We’re seeing a clear rising wedge forming near the top of a strong run-up — typically a bearish reversal pattern. Price tagged $167.89 and pulled back slightly, closing at $164.92.
If this breaks down, watch the $148.67 - 151.31 area, and below that $125 as a key level. Bulls want to see a strong hold and breakout above $168 to invalidate the wedge.
#NVDA #NVIDIA

$NVDA – Going Long Long LONGTaking a long position here at $98 – yes, despite the noise.
There’s no denying the pressure across semiconductors following renewed tariff threats from the Trump administration. But I believe this is more short-term overreaction than long-term damage. Any meaningful negotiation or de-escalation could act as a slingshot for these names, especially leaders like Nvidia.
Nvidia's fundamentals remain incredibly strong. The company is still outpacing its peers in AI, data centers, and gaming hardware. Profitability remains intact, and there’s no indication of a breakdown in their competitive edge.
Technicals are giving us some strong signals:
We're seeing a long-term bullish divergence forming.
RSI is approaching oversold territory – rare for Nvidia and historically a signal for strong bounces.
Price is nearing key long-term support levels that held in previous cycles.
I'm positioning early here because I believe the broader market is mispricing geopolitical risk. If the situation improves – and it often does faster than expected – NVDA is one of the first names that will rebound aggressively.
Let’s see how this plays out, but I’m confident this is a high-conviction entry point in the 80's and 90's.

Speculative advice I don’t think Mr burry was ready or sold too soon. I still see a bit more potential from NVDA…I too will be leveraging on some puts near the top. NFA only trade what you can afford to lose. Remember to leave me your comments 📝
$NVDA - $270 PT in BULL ChannelThe stock is currently bouncing off of the lower channel line of the rising Bull Channel. Price action has created a Cup and Handle. The projected Price Objective sits at around $270. Remember, the height of the cup is the project target which from current stock price extends to around $270.

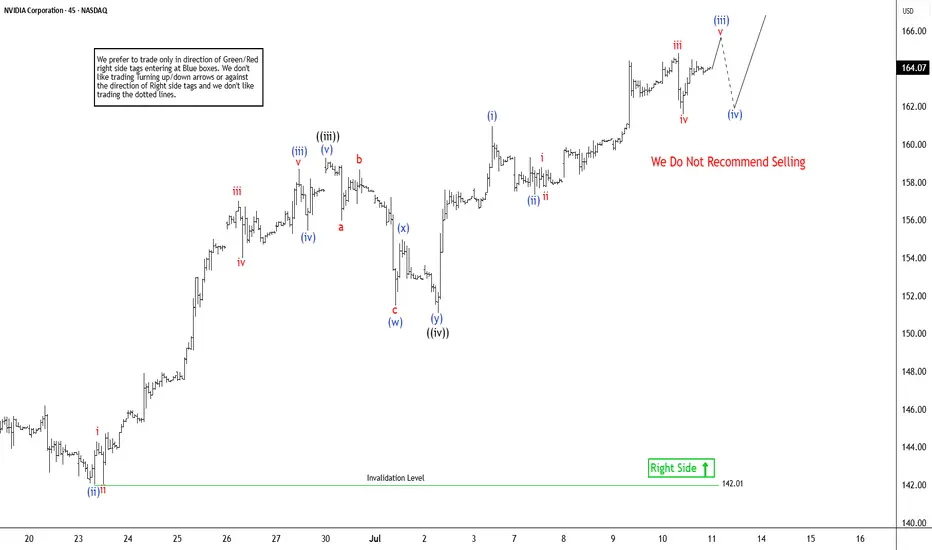
NVIDIA ($NVDA) Elliott Wave Outlook: Larger Pullback on the HoriNvidia (NVDA) continues its remarkable ascent, consistently reaching new all-time highs and reinforcing a robust bullish outlook. The ongoing rally, which began from a significant low on April 7, 2025, remains structured as an impulsive wave pattern, indicative of strong upward momentum. However, despite the potential for further short-term gains, the cycle appears mature. This suggests a larger-degree pullback could be imminent. Investors should exercise caution when considering chasing this rally in shorter time frames, as the risk of a corrective move grows.
In the short term, the cycle initiated from the June 2 low is progressing as a lower-degree impulse. From this low, wave ((i)) peaked at $144, followed by a corrective pullback in wave ((ii)) that concluded at $137.88. The stock then surged in wave ((iii)) to $159.42. The subsequent wave ((iv)) correction unfolded as a double-three structure, with wave (w) ending at $151.49, wave (x) at $154.98, and wave (y) completing at $151.10, finalizing wave ((iv)). Currently, Nvidia is advancing in wave ((v)), exhibiting a five-wave subdivision. Within this, wave (i) of ((v)) reached $160.98, with a minor pullback in wave (ii) concluding at $157.34. As long as the pivotal low at $142.01 holds, any near-term pullbacks are likely to attract buyers in a 3, 7, or 11-swing pattern, supporting further upside potential. This technical setup underscores Nvidia’s strength but highlights the need for prudent risk management.
Nvda bearish ideaGiven the recent euphoric blast of NVDA on the AI wave, I'm calling for a deep technical correction. While fundamentals are still there, it shows overvaluation and is in dire need of a cool off period

A bit of profit taking on NVDA and then up again?NASDAQ:NVDA is the most talked about and everyone is capitalizing on that. Let's take a look.
NASDAQ:NVDA
Let us know what you think in the comments below.
Thank you.
75.2% of retail investor accounts lose money when trading CFDs with this provider. You should consider whether you understand how CFDs work and whether you can afford to take the high risk of losing your money. Past performance is not necessarily indicative of future results. The value of investments may fall as well as rise and the investor may not get back the amount initially invested. This content is not intended for nor applicable to residents of the UK. Cryptocurrency CFDs and spread bets are restricted in the UK for all retail clients.

NVIDIA: Sell ideaSell idea on NVIDIA as you can see on the chart if only and only if we have the breakout with force the support line and the vwap indicator by a big red candle follow by a large red volume.

Nvidia Market Capitalisation Reaches $4 TrillionNvidia Market Capitalisation Reaches $4 Trillion
Yesterday, Nvidia’s (NVDA) share price surpassed $162 for the first time in history. As a result, the company’s market capitalisation briefly exceeded $4 trillion during intraday trading (according to CNBC), making Nvidia the first publicly listed company to reach this milestone.
The rise in NVDA’s share price is being driven by both bullish sentiment across the broader equity market—which appears optimistic ahead of the upcoming Q2 earnings season—and evidence of sustained demand for Nvidia’s products, as artificial intelligence technologies continue to gain widespread adoption.
Noteworthy developments include:
→ Nvidia may begin producing a specialised AI chip for the Chinese market this autumn, potentially circumventing current export restrictions;
→ Perplexity, a company backed by Nvidia, is launching an AI-powered browser aimed at competing with Google Chrome.
Technical Analysis of NVDA Chart
In our previous analysis of NVDA’s price action, we:
→ Drew an ascending channel;
→ Highlighted bullish conviction in overcoming the $145–150 resistance zone.
The channel remains valid, with the current price trading near its upper boundary. However, the RSI indicator is showing signs of bearish divergence, suggesting that the stock may be vulnerable to a near-term correction—potentially towards the median line of the existing upward channel.
At the same time, a major shift in the prevailing bullish trend appears unlikely. The $145–150 range may serve as a key support zone for NVDA in the foreseeable future.
This article represents the opinion of the Companies operating under the FXOpen brand only. It is not to be construed as an offer, solicitation, or recommendation with respect to products and services provided by the Companies operating under the FXOpen brand, nor is it to be considered financial advice.

NVDA: Ready for a Gamma Squeeze or Cooling Off? for July 10NVDA: Ready for a Gamma Squeeze or Cooling Off? Here's the Setup You Need 🎯
Options Sentiment (GEX Analysis):
NVDA is trading around $163.35 and sitting just above the Gamma Wall at $162.50, which also marks the highest positive NET GEX zone—a key resistance created by dealer positioning. Above that, the second CALL Wall is stacked near $165, with further resistance layering in toward $170 and $172.50.
Below, there’s a liquidity pocket around $157.50 (HVL zone), and deeper PUT support doesn’t come in until $152.50–$151.00.
* GEX: Bullish leaning (CALLS 2.6% domination, GEX bar fully green)
* IVR: Low at 5.9, and IVx Avg 38 → Options are relatively cheap.
* Sentiment: Leaning bullish with potential for a gamma squeeze if momentum builds above $165.
🟢 Strategy Suggestion:
Consider 160C or 165C weekly calls (with tight spreads) if NVDA holds above $162.50 and breaks through $165 with volume. A gamma squeeze toward $170 is on the table.
Risk-managed PUTs (e.g., 158P) only if price flushes back below $160 support with momentum.
1-Hour Chart Technical Outlook:
NVDA has broken out of the previous range, flipping internal structure bullish. The CHoCH and BOS confirm trend change earlier this week, and the price is now consolidating just under a resistance zone (purple box) near $164.
Support below is layered at:
* $160 (broken resistance, now key support)
* $158.05 (previous structure low)
* $152.00–151.00 (demand zone + GEX support alignment)
Resistance:
* $164.41 (current high)
* $167.50, $170, $172.50 (GEX option walls)
Structure is showing a rising wedge/channel pattern; however, we’re still trending strong with clean higher lows.
🟢 Long Trade Setup (Bullish Continuation):
* Entry: Above $164.50 with breakout confirmation
* Target: $167.50 → $170
* Stop: Below $160 (or tighter below $162.50 based on risk appetite)
🔴 Short Trade Setup (Reversal Scenario):
* Entry: Breakdown below $160 with rejection from $163–$164
* Target: $158 → $152 zone
* Stop: Above $165
My Thoughts:
NVDA is sitting in a key decision zone. As long as it holds above $162.50, bulls have the edge to push this higher into the next GEX walls. Watch for confirmation on $164.50 breakout for continuation. If it fakes out and drops below $160, that would likely trigger a downside flush to $158 or lower.
This analysis is for educational purposes only and does not constitute financial advice. Always do your own research and trade responsibly.

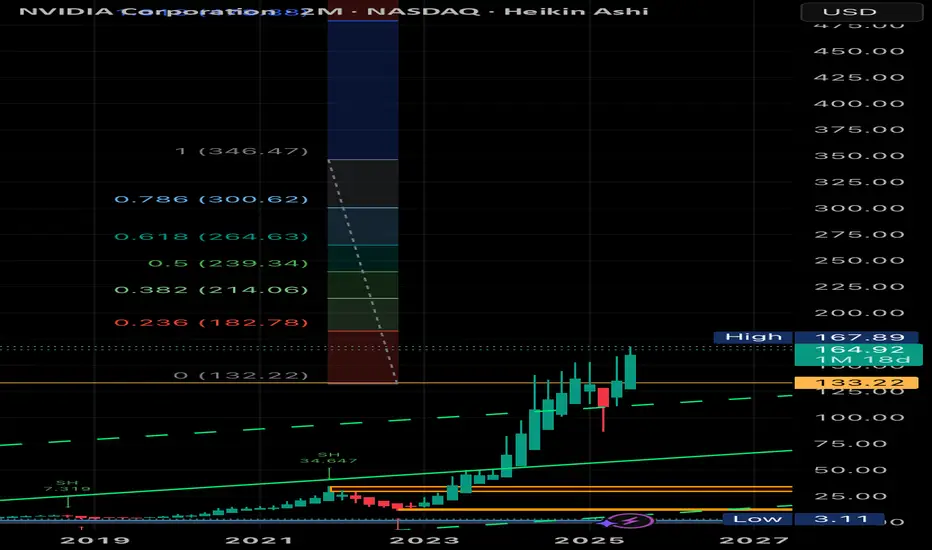
NVIDIA – Best Buy of the Decade (4T Record but now resistance)🚀🔥 NVIDIA – Best Buy of the Decade Post #6
💡📉 Great but why am I taking half profits Today?
Back in July 2021, I named NVIDIA "The Best Buy of the Decade. " Today, it just hit a mind-blowing milestone — becoming the first company to reach a $4 trillion market cap. But here's the thing... that happened right at major resistance.
From our initial call in 2021 , to the target at $143.85 drawn via parabola in 2023, to the April 2025 re-entry at $95, it’s all on the chart — and it's been a textbook ride so far.
At the current level of $163.89, we’re pressing into serious overhead resistance. This doesn’t mean the story is over — not even close. But it could mean we take a breather before the next leg higher.
🧭 Targets ahead remain unchanged:
🔹 First stop: $182.85
🔹 Long-term vision: $227.41
What started as a bold macro call in 2021 has now become a multi-year thesis with precision updates along the way. This is post #6 in the NVIDIA journey — and if you scroll back through the chart, each piece has built on the last with clarity and conviction.
🎯 NVIDIA is not just a tech stock — it’s the AI backbone. But every cycle has pauses, and this one looks ready for a short rest before we see the next breakout.
Stay sharp, follow the structure, and honor the parabola.
One Love,
The FX PROFESSOR 💙
Additional info, for those who like to dive deeper into NVDA:
🔍 Technical Breakdown Version
For the chartists and structure followers, here’s the breakdown:
📌 2021: Original call — "Best Buy of the Decade"
📌 2023: First parabola plotted, projecting toward $143.85 — target hit precisely
📌 April 2025: Market offered $95 re-entry — second parabola begins
📌 Now: Price sits at $163.89, testing resistance from both structure and Fibonacci
📌 Next levels:
- $182.85 → Key extension level
- $227.41 → Long-term target based on full parabolic arc
Current structure suggests a possible pause before continuation. No need for panic — parabola remains valid unless structure is broken. Volume still supportive, and price action is following projection beautifully.
🧠 AI Macro Narrative Version
The big picture? NVIDIA isn't just another semi stock — it’s the nervous system of the AI revolution.
From gaming → crypto → AI, NVIDIA has consistently been first to adapt, and now it’s the leader in AI hardware infrastructure. The $4 trillion milestone is more than symbolic — it represents capital reallocation toward AI as the next dominant sector.
🧠 Key macro takeaways:
AI demand is insatiable
Data centers need NVIDIA
Generative AI isn't slowing down
Institutions are still buying — not selling
The resistance we see now isn’t weakness — it’s the market pausing to digest before another acceleration. Just like every past cycle... we ride, retrace, reload, and resume.
Disclosure: I am happy to be part of the Trade Nation's Influencer program and receive a monthly fee for using their TradingView charts in my analysis. Awesome broker, where the trader really comes first! 🌟🤝📈

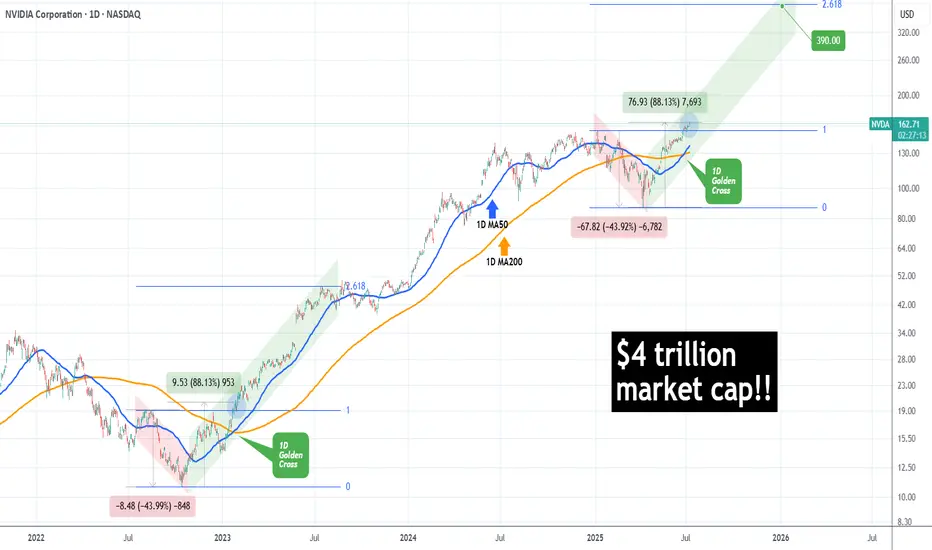
NVIDIA made history! First company with $4 trillion market cap!NVIDIA Corporation (NVDA) became today the first company in history to surpass a $4 trillion market value, as A.I. bulls extended the recent rally and pushed the price past the approximate $163.93 level needed to reach this market capitalization threshold.
The long-term trend on the 1D time-frame couldn't look more bullish. Coming off a 1D Golden Cross less than 2 weeks ago, the price has turned the 1D MA50 (blue trend-line) into Support and sits at +88.13% from the April 07 2025 Low.
This is the exact set-up that the market had when it was coming off the 2022 Inflation Crisis bottom (October 13 2022). As you can see, both fractals started with a -44% decline, bottomed and when they recovered by +88.13%, there were just past a 1D Golden Cross. In fact that Golden Cross (January 24 2023) was the last one before the current.
NVIDIA entered a Channel Up (green) on its recovery and for as long as the 1D MA50 was supporting, it peaked on the 2.618 Fibonacci extension before it pulled back below it.
If history repeats this pattern, we are looking at a potential peak around $390, which may indeed seem incredibly high at the moment, but as we pointed out on previous analyses, the market is in the early stages of the A.I. Bubble, similar to the Internet Bubble of the 1990s.
-------------------------------------------------------------------------------
** Please LIKE 👍, FOLLOW ✅, SHARE 🙌 and COMMENT ✍ if you enjoy this idea! Also share your ideas and charts in the comments section below! This is best way to keep it relevant, support us, keep the content here free and allow the idea to reach as many people as possible. **
-------------------------------------------------------------------------------
💸💸💸💸💸💸
👇 👇 👇 👇 👇 👇
NVDA$ - possible pullback to $50 (-67% from pick) in the making.NASDAQ:NVDA have done this before (67% pullbacks after long rally).
NVDA is following very predictable patterns for many years now, despite excitement around this stock - stock made "new recent low" and current rally maybe just a part of a "head and shoulders" in the making. If "new all time high" is not reached with in the next few weeks - we will see stock pullback to $50 or less in the next 6-9 month.

NVDA Testing Gamma Ceiling — Eyes on 162.5 🔩 Options Sentiment & GEX Analysis
NVDA is pressing into a critical Gamma Wall at 162.5, which aligns with the highest positive NET GEX and second-tier Call Wall concentration. Dealers are likely short calls here, meaning a breakout could trigger gamma-induced hedging, fueling a squeeze.
* Call Walls: 162.5 → 165 → 167.5 → 170
* Put Walls: 157.5 → 155 → 152
* GEX Skew: Strong bullish exposure into 162.5, suggesting a resistance zone but also potential fuel if breached.
* IVR: 6.6 — Implied Volatility remains cheap, ideal for directional plays.
* IVx Avg: 38.6 — still elevated, giving edge to debit spreads.
* Put/Call Ratio: 0.2% Puts – overly call-heavy positioning adds risk of dealer chasing if breakout occurs.
🧠 GEX-Based Option Trade Ideas
📈 Bullish Gamma Squeeze Play
* Setup: Buy 160/165 Call debit spread (Jul 19 or Jul 26 expiry).
* Trigger: Break & close above 161 with volume.
* Target: 165 → 167.5
* Why: Breaching Gamma Wall at 162.5 opens room to next Call Walls. Dealer hedging could force rapid upside.
📉 Bearish Fade Setup
* Setup: Buy 160/155 Put debit spread
* Trigger: Failure to reclaim 161–162.5 zone with clear rejection pattern.
* Target: 157.5 → 155
* Why: Rejection at GEX ceiling could unwind recent rally, especially if broader market rolls over.
🧭 1-Hour Technical Chart Overview
NVDA is consolidating tightly under its Gamma resistance within a clear ascending channel.
🔍 Structure & SMC Highlights
* Series of Breaks of Structure (BOS) confirms bullish trend.
* CHoCH zones have been retested and flipped bullish around 157.5.
* Current price is compressing under a key supply zone at 160.98–162.5, with rising trendline providing support.
* A clean bullish reaction from the 157.5 order block shows buyer interest is intact.
🔨 Levels to Watch
* Key Resistance: 161 → 162.5 (GEX ceiling, prior swing highs)
* Support Zone: 157.5 → 155 (prior CHoCH and OB zone)
* Trendline: Acting as dynamic support from June lows
📌 Trading Plan (1H Price Action Focus)
Long Setup
* Trigger: Break above 161 with bullish candle close and volume
* Entry: 161.20–161.50
* Stop: Below 159.80 (last demand zone wick)
* Target: 165 first, then 167.5
* Bias: Trend continuation + gamma squeeze
Short Setup
* Trigger: Rejection at 162.5 with bearish engulfing or shooting star
* Entry: 161.80–162.50
* Stop: Above 163
* Target: 157.5 → 155
* Bias: Fade extended rally into gamma wall
🧠 Summary
NVDA is perched just under a powerful options-driven ceiling. Whether this turns into a breakout squeeze or a sharp rejection depends on how price reacts to the 161–162.5 zone. Traders should prepare for both scenarios with defined-risk debit spreads and lean into price confirmation before committing.
This analysis is for educational purposes only and does not constitute financial advice. Always do your own research and manage risk carefully.

Nvidia - New all time highs!Nvidia - NASDAQ:NVDA - breaks out now:
(click chart above to see the in depth analysis👆🏻)
Within two and a half months, Nvidia rallied more than +70%. Following this recent bullish strength, a retest of the previous highs was totally expected. But this does not seem to be the end at all. There is a much higher chance that we will see new all time highs soon.
Levels to watch: $150
Keep your long term vision🙏🙏
Philip (BasicTrading)

NVDA Analysis To 164?Quick breakdown of NVDA
Appears we hit our corrected level, we could go deeper possibly or hold at this level and drive up to 164
This is looking like a nice little setup long indeed
Trade Smarter Live Better
Kris/Mindbloome Exchange
