Failed Past WeekNot only my first long has failed past week but the test of the fresh bottom as well.
We are still within the support zone but it seems to become clearer now that there is a serious bottom building.
It is nor all decided yet as there is an open window to be closed at 121.35-122.29.
Buit when this will have been overcome we may see a further run up.
Another long position will speculate on the close of the window first.
R66 trade ideas

Window Closing2 weeks ago we had opened wid a downward window. Now we are going to retrace the decline and may go to close the window.

$PSX Squeeze Whats your thoughts on NYSE:PSX I currently have it in a wholesale area looking for buying opportunities aka Higher Highs ...
I believe the stock has great potential for growth. The average analyst rating is positive, with an average price target of $157.43 of course I dont care what they think In the chart I Trust...

PSX Phillips 66 Options Ahead of Earnings Analyzing the options chain and the chart patterns of PSX Phillips 66 prior to the earnings report this week,
I would consider purchasing the 150usd strike price Calls with
an expiration date of 2024-7-19,
for a premium of approximately $14.05.
If these options prove to be profitable prior to the earnings release, I would sell at least half of them.

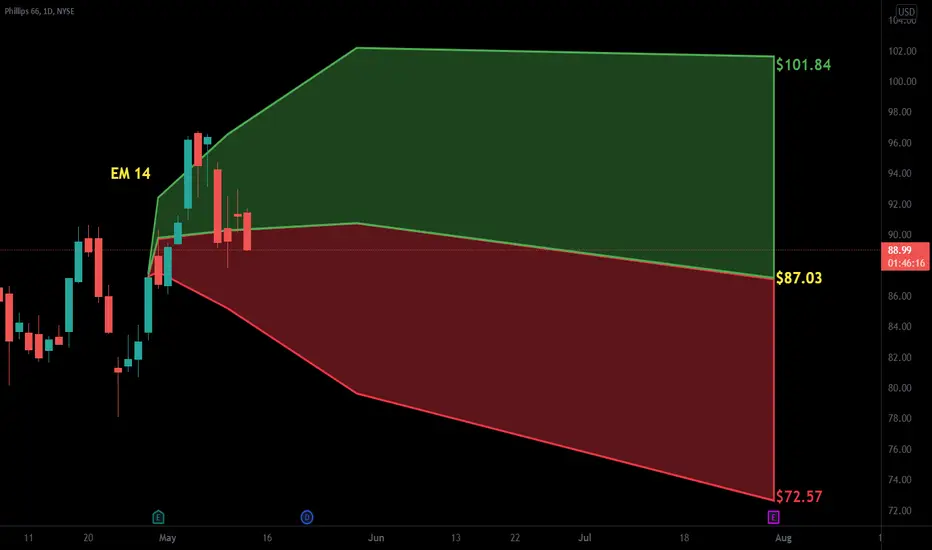
Box on $PSXThe hourly chart shows a nice pullback to the ema 50 with the emas unable to create a bearish crossover.

PSX symmetrical triangle breakout!!In the books, it is written that symmetrical triangles are formed because of uncertainty. The market is forming an opinion about the direction of the asset.
Moreover, it is said that symmetrical triangles have a higher probability of being a continuation pattern.
If we apply those learnings to PSX, we have the following analysis:
After an uptrend in prices, the market had some uncertainty about the direction of the asset. And, today's possible breakout confirms that symmetrical triangle have higher probability of being continuation pattern.
According to the books, this breakout closer to the apex of the pattern increases the chance of it failing. Moreover, symmetrical triangles are known to be less reliable patterns.
Therefore, such breakout suggests a continuation of the uptrend after a pause, however, we need to be more cautions and await a pssible failure.
Now, if it's not a false breakout, the highest probability is that prices will move quicly and with larger amplitue than the pattern itself. (100% form its base to its top).
Let's see!!

PSX | InformativeNYSE:PSX
Overall Trend: The stock has been following an upward trend, as evident from the upward-sloping blue trendline. This suggests bullish momentum.
Candlesticks:
We see a mix of bullish and bearish candles, but the bullish candles are larger in body, suggesting stronger buying pressure.
The large blue candlestick in the recent period might indicate strong buying interest.
Moving Averages:
The stock is trading above both the short-term and long-term moving averages, which is a bullish indicator.
The moving averages are also in an upward trajectory, further affirming the bullish momentum.
Support and Resistance:
Bullish Line (Resistance turned Support): The stock has broken above the "Bullish Line" at 116.77 USD, turning it into a potential support.
Bearish Line (Resistance): At 115.23 USD, if the stock moves downwards, this could be a resistance point to watch.
Price Targets:
Target Price 1: 113.80 USD - If there's a pullback, this could be a potential lower target.
Target Price 2: 111.56 USD - A further downward target if the stock faces more selling pressure.
Target Price 1: 118.50 USD - An upward target if the bullish momentum continues.
Target Price 2: 119.78 USD - A higher potential target with continued bullish activity.
Volume:
A significant spike in volume accompanies the large bullish candlestick, suggesting strong buying interest.
RSI (Relative Strength Index): The RSI is hovering around the middle range. It's not in the overbought or oversold territories, suggesting that there's room for the stock to move in either direction.
Summary:
The stock shows signs of bullish momentum, with strong buying interest evident from the recent large bullish candlestick and the upward trend. The break above the Bullish Line is a positive sign. However, it's essential to watch for potential pullbacks towards the bearish line and monitor the stock's movement in conjunction with real-world news or financial data related to Philips 66.

PSX: Ascending Triangle, Not Confirmed (89,92%)(32/1000)(32/1000)
Ascending Triangle for PSX on the weekly chart.
Not confirmed
Possible 89,92% gains.
As per graph on the right, energy sector (SPN) is building into an ascending triangle (not confirmed) with a possible 41,62% gain.
PSX analysis:
Pros:
1- Bullish Ascending triangle
3- PPS above 50MA and 200MA
3- R/R ratio above 5
4- 250RSI above 50 and ascending
5- 50MA ascending
6- RS above 0 and ascending
7- 50MA above 200MA
8- Golden cross in blue
Cons:
1- 200MA flat
2 - ATR descending, less volatility
Target price is 235,25$
Stay humble, have fun, make money!
MAAX!

$PSX with a Bearish outlook following its earnings #Stocks The PEAD projected a Bearish outlook for $PSX after a Negative Under reaction following its earnings release placing the stock in drift D with an expected accuracy of 71.43%.

Phillips 66 (PSX) Technical Analysis: A Positive OutlookGolden Cross
The 20 moving average on the daily chart has crossed above the 50 moving average today.
Monthly High
Stock price is at monthly highs.
Pivot Machine Gun (PMG)
When price makes continued highs for 5 days. This is a bearish reversal signal
only if price starts to break the low of the last day's candle.
Volume Shelf Launchpad
When price starts to move with some momentum from a volume shelf, it is called a volume shelf launchpad.
CCI Buy Trigger
Commodity channel index (CCI) crossed the 0 level to the upside thus triggering a buy signal.

$PSX with a Bullish outlook following its earnings #Stocks The PEAD projected a Bullish outlook for $PSX after a Positive over reaction following its earnings release placing the stock in drift B with an expected accuracy of 83.33%.

PSX | Time to Short This | OverboughtPhillips 66 operates as an energy manufacturing and logistics company. It operates through four segments: Midstream, Chemicals, Refining, and Marketing and Specialties (M&S). The Midstream segment transports crude oil and other feedstocks; delivers refined petroleum products to market; provides terminaling and storage services for crude oil and refined petroleum products; transports, stores, fractionates, exports, and markets natural gas liquids; provides other fee-based processing services; and gathers, processes, transports, and markets natural gas. The Chemicals segment produces and markets ethylene and other olefin products; aromatics and styrenics products, such as benzene, cyclohexane, styrene, and polystyrene; and various specialty chemical products, including organosulfur chemicals, solvents, catalysts, and chemicals used in drilling and mining. The Refining segment refines crude oil and other feedstocks into petroleum products, such as gasolines, distillates, aviation, and renewable fuels at 12 refineries in the United States and Europe. The M&S segment purchases for resale and markets refined petroleum products, including gasolines, distillates, and aviation fuels primarily in the United States and Europe. This segment also manufactures and markets specialty products, such as base oils and lubricants. The company was founded in 1875 and is headquartered in Houston, Texas.
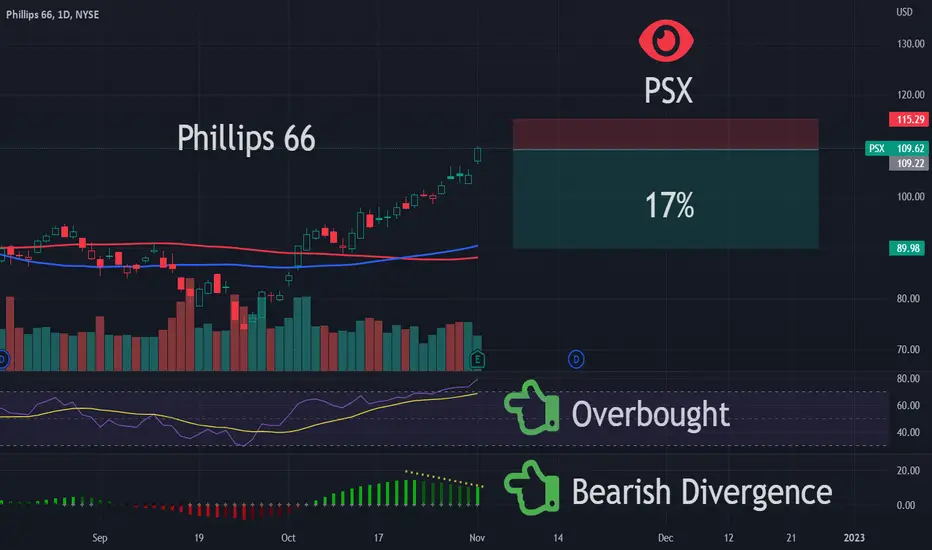
at 2 separate trend resistance zones 🔴 make or breakbreak of this resistance will lead to new all time highs (pretty close to confirmed breakout)
rejection here and expect dump to trend support 👀

PSX long W Formation - 17 Oct 2022PSX has just broken out of a W Formation.
The target is now set to 144.22.
CONCERNS: Medium probability trade as the previous trend was sideways...


$PSX with a Bullish outlook following its earnings #Stocks The PEAD projected a Bullish outlook for $PSX after a Positive over reaction following its earnings release placing the stock in drift B with an expected accuracy of 100%.

$PSX - Phillips 66 - Wace C ?From the March 2020 bottom at $40.04, the recovery qualifies to be labelled as a Leading Diagonal.
Leading Diagonals are found in wave 1 or wave A of impulses and zig zag corrections respectively.
In this scenario, the correction from $111.28 should terminate above $40.04.
The correction seems to be unfolding as an ABC zigzag.
Using the Fibonacci extension guidelines, wave C, if it is as long as wave A, will reach $59.22.
In the bear case scenario where the recovery from $40.04 is a WXYXZ, a new low should print below $40.04.
Any short position should use a stop-loss at $94.75, the wave B high.

$PSX Long - bounce off bottom bullish channel and 200 MAGood risk reward, risking $2 to make $3, ideally exit before earnings

PSX - Strong Resistance Turned Strong SupportThe Solid Green line is now a strong support
Areas in white circles are very similar
We can expect bullish results

25/5/2022 NYSE (PSX)Buy (Entry Price) above the black line and exit (Stop Loss) below the red line. Can take profit at the suggested Target Price.
Entry Price: $95.75
Target Price: $97.80
Stop Loss: $93.70

$PSX For the breakout tradersMarket hasn't favored the breakout stocks but PSX has continuously shown strength and finally broken out from a nice triangle consolidation pattern since 2020.
Livermore effect with 100 magnet and then some if trade plays out. Nice volume uptick past weeks and RSI bullish confluence
I'm long JUN 100 calls , stop at 50% premium.

$PSX with a Neutral outlook following its earnings #Stocks The PEAD projected a Neutral outlook for $PSX after a Positive Under reaction following its earnings release placing the stock in drift A with an expected accuracy of 33.33%.
Phillips 66 (NYSE: $PSX) On Bottom Of Bullish Channel! 🔥Phillips 66 operates as an energy manufacturing and logistics company. It operates through four segments: Midstream, Chemicals, Refining, and Marketing and Specialties (M&S). The Midstream segment transports crude oil and other feedstocks; delivers refined petroleum products to market; provides terminaling and storage services for crude oil and refined petroleum products; transports, stores, fractionates, exports, and markets natural gas liquids; provides other fee-based processing services; and gathers, processes, transports, and markets natural gas. The Chemicals segment produces and markets ethylene and other olefin products; aromatics and styrenics products, such as benzene, cyclohexane, styrene, and polystyrene; and various specialty chemical products, including organosulfur chemicals, solvents, catalysts, and chemicals used in drilling and mining. The Refining segment refines crude oil and other feedstocks into petroleum products, such as gasolines, distillates, aviation, and renewable fuels at 12 refineries in the United States and Europe. The M&S segment purchases for resale and markets refined petroleum products, including gasolines, distillates, and aviation fuels primarily in the United States and Europe. This segment also manufactures and markets specialty products, such as base oils and lubricants. The company was founded in 1875 and is headquartered in Houston, Texas.
