Sembcorp Surprises with Dividend Hike & $1B Net ProfitSembcorp Industries has entered a “new normal,” delivering ... in adjusted net profit for FY2024, marking a .... year-on-year (y-o-y) growth and surpassing analyst expectations. In a surprise move, the company announced a higher dividend of ..... cents per share, up from 13 cents in FY2023, with a ..... payout ratio, signaling strong cash flow across its business segments.
SBOA trade ideas

Buying Sembcorp Industry for a SOW reboundSembcorp is in a larger distributive phase and is likely to see short to mid-term rebound as it is in a SOW phase. Meaning that there is a possibility of a UT test in phase B going beyond 6.00. Key support remain at 4.07-4.38

Sembcorp is turning bullishSembcorp is turning bullish
Buy Entry price $5.05
First upside target price:$5.39
Second upside target price:$5.5
Stop loss price:$4.91

U96.SGX_Bullish Pullback Trade_LongENTRY: 2.88
SL: 2.75
TP1: 3.04
TP2: 3.20
- ADX<20. Would like to be higher.
- Daily RS +ve
- Daily FFI +ve
- Weekly RS +ve
- Weekly FFI +ve
- Moving averages are aligned.
- Stoch RSI rebounding off 30.
- Brokeout previously on 7 Apr 2022 with volume and retraced to resistance-turn-support area.
- 17 Jun 2022 hammer candle shows potential buyers coming in.
- Entry today based on >2% rebound off 10EMA with volume

Sembcorp Industries - 5th wave on the move?Sembcorp has made a strong up move since the breakout of the symmetrical triangle in early Jan 2022. Moving forward, prices have recently completed an extended sub-wave (3) and to add on, the potential pennant is hinting a bullish continuation to the upside. Also, bullish morning star formation further reiterates the bullish upside.

Semcorp Industry, not really a strong buySemcorp Industry got its happy ending after divorce from its toxic marriage with Sembcorp Marine. Price has been up ever since. In fact, we had a previous buy call back in April 2021. It hits our TP level of 2.20 back then, and it is now trying to re-test the resistance at 2.30 again.
Whether it can break the resistance or not, we cannot say. However, as long as the price is maintained above the support level of 1.63, Sembcorp Ind remains bullish. It could consolidate for months or years before it can break out, nobody knows. Hence holding power is important because there is no analysis that can predict time. There is also another major resistance at the 2.50 level, which makes it less attractive to other available options out there.
On the bright side, it does have a dividend yield of 3.0% at its current price. So you're not really "losing" for holding if the price goes sideway for a prolonged period
Verdict: If you wish to buy, make sure you can hold. I, personally will look for better options.


U96.SGX_ST LongENTRY: 1.70
TP: 1.80-1.84
SL: 1.63
- ADX>25 today (11 Nov 2020)
- RSI>65 today. (11 Nov 2020)
- MAs are aligned
- Decent volume today
- Was hoping for closing to be better
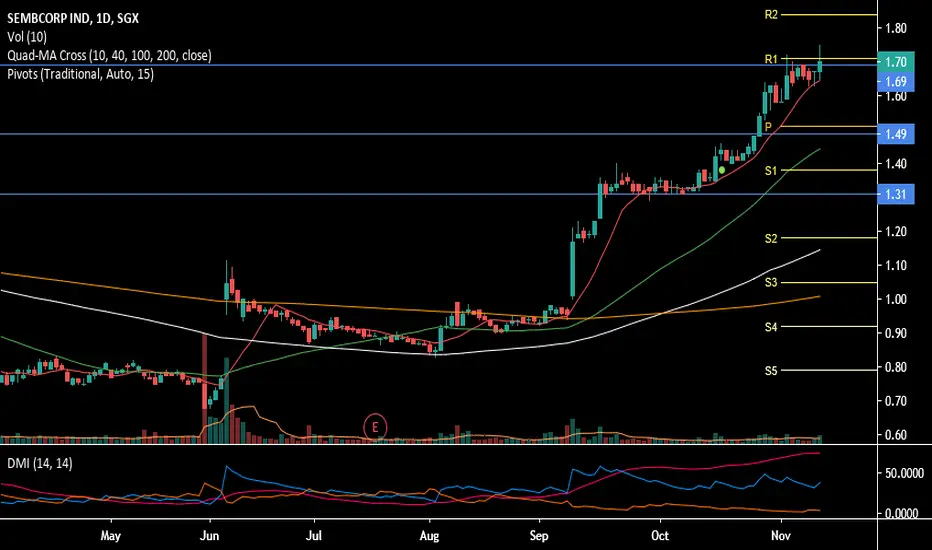
Bullish Expectations: Broke out of Trading Range (JAC)Sembcorp Ind (U96) traded above its consolidation range (JAC) today.
A summarized analysis, we noted that supply has been weak throughout the 21 days range. We also noted that an early spring on 29 Sept.
On the other hand, demand returned near to the end of the range, with Sign of Strength (12 Oct) and JAC today (15 Oct).
Here's our plan:
Entry: On Open
Target Price: S$1.55- S$1.60
Stop Price at S$1.31 (Below HVN Level)
Trading Stop: 7D SMA
Fundamentally, company may be expecting more solar related projects.


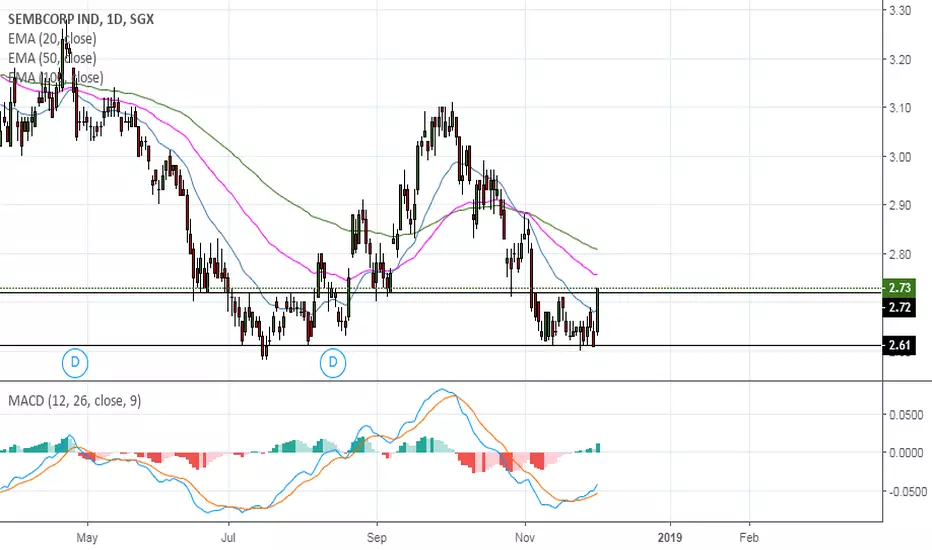
Sembcorp Ind took support may form Double Botton After Weak earning stock fall sharply and made low around 2.60.To consider downtrend is over stock have to close and trade above Level of 2.72.
All major Exponential Moving Averages are still pointing downwards. Fresh Down ward momentum picks up when stocks close below 2.60 and open downward trajectory till 2.50


SembCorp Industry - Potential long in the makingTechnicals/Charts:
- Approaching the Support/Resistance at 3.20/3.30 levels
- Weekly RSI turned up at 50 - showing strength still
- MACD consolidating for some time
I would like to see price break above the resistance TL and the support turned resistance zone with high than usual volume.
This will give an indication of a strong rally.
