SHOO | Long | Accumulation Around VWAP + Value Setup |(May 2025)SHOO | Long | Accumulation Around VWAP + Value Setup | (May 2025)
1️⃣ Short Insight Summary:
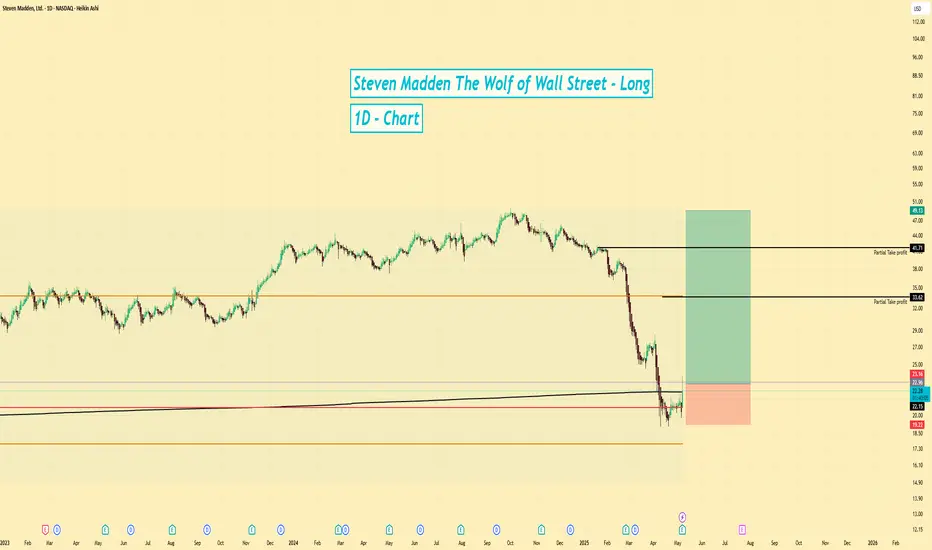
Steve Madden (SHOO) is showing signs of accumulation near VWAP support, suggesting smart money could be positioning for a move higher. Strong fundamentals and a low debt profile make this setup appealing.
Next report date
—
Report period
—
EPS estimate
—
Revenue estimate
—
2.2 EUR
163.63 M EUR
2.21 B EUR
70.96 M
About Steven Madden, Ltd.
Sector
Industry
CEO
Edward R. Rosenfeld
Website
Headquarters
Long Island City
Founded
1990
FIGI
BBG000BSJ5M9
Steven Madden Ltd. engages in the design, marketing, and sale of fashion-forward footwear for women, men, and children. It operates through the following segments: Wholesale Footwear, Wholesale Accessories and Apparel, Direct-to-Consumer, First Cost, and Licensing. The Wholesale Footwear segment includes branded and private label women's, men's, girl's and children's footwear. The Wholesale Accessories and Apparel segment consists of branded and private label handbags, belts and small leather goods, and cold weather and selected other fashion accessories. The Direct-to-Consumer segment distributes branded footwear, apparel and accessories directly to the consumer. The First Cost segment earns commissions and design fees for serving as a buying agent of footwear products to mass-market merchandisers, mid-tier department stores, and other retailers. The Licensing segment licenses its trademarks for use in connection with the manufacture, marketing, and sale of outerwear, hosiery, active wear, sleepwear, jewelry, watches, hair accessories, umbrellas, bedding, luggage, and men's leather accessories. The company was founded by Steven L. Madden on July 9, 1990 and is headquartered in Long Island City, NY.
SHOO trianglebreakout may appear soon. price touched decreasing trendline. be ready to act on price swing.

✅ STOCK REVIEW: $SHOOSHOO experienced a significant upsurge, climbing from $30.35 to $44.23 from September to December, followed by a typical pullback of approximately 10.67% from its peak to a low of $39.45.
This correction is viewed positively as it likely indicates the elimination of less committed investors.
Notab

SHOO - symmetrical triangleInteresting opportunity for $NASDAQ:SHOO. Large price range in response out earnings. It wicked out of this symmetrical triangle, reversed when it ran into the VWAP from ATH, and then fell back to the VWAP from Februarys beginning of the formation. SHOO has slow but steady fundamental performance ov

SHOO 2523Bounced off a long term trend line
Higher low, seller exhaustion. Bull market has not been confirmed. Simply common retraces we could see. I look towards 50 percent corrections of the entire move . Will look into the lower time frames at a later time.

SHOO : two ways to buy shares (medium term)For Trade #1, refer to the linked related ideas below for reasons why I bought shares there
//The exit strategy (price close below the EMA ribbon) will be ignored if not already in profit and/or haven't hit 3R. Keep the trade on as long as the stoploss hasn't been hit yet
For Trade #2, TSI Shadow


See all ideas
Summarizing what the indicators are suggesting.
Neutral
SellBuy
Strong sellStrong buy
Strong sellSellNeutralBuyStrong buy
Neutral
SellBuy
Strong sellStrong buy
Strong sellSellNeutralBuyStrong buy
Neutral
SellBuy
Strong sellStrong buy
Strong sellSellNeutralBuyStrong buy
An aggregate view of professional's ratings.
Neutral
SellBuy
Strong sellStrong buy
Strong sellSellNeutralBuyStrong buy
Neutral
SellBuy
Strong sellStrong buy
Strong sellSellNeutralBuyStrong buy
Neutral
SellBuy
Strong sellStrong buy
Strong sellSellNeutralBuyStrong buy
Displays a symbol's price movements over previous years to identify recurring trends.
Curated watchlists where SJM is featured.


Related stocks
Frequently Asked Questions
The current price of SJM is 21.0 EUR — it has increased by 17.71% in the past 24 hours. Watch STEVEN MADDEN DL-,0001 stock price performance more closely on the chart.
Depending on the exchange, the stock ticker may vary. For instance, on FWB exchange STEVEN MADDEN DL-,0001 stocks are traded under the ticker SJM.
SJM stock has risen by 13.19% compared to the previous week, the month change is a 1.98% rise, over the last year STEVEN MADDEN DL-,0001 has showed a −43.85% decrease.
We've gathered analysts' opinions on STEVEN MADDEN DL-,0001 future price: according to them, SJM price has a max estimate of 33.85 EUR and a min estimate of 14.25 EUR. Watch SJM chart and read a more detailed STEVEN MADDEN DL-,0001 stock forecast: see what analysts think of STEVEN MADDEN DL-,0001 and suggest that you do with its stocks.
SJM stock is 1.90% volatile and has beta coefficient of 0.84. Track STEVEN MADDEN DL-,0001 stock price on the chart and check out the list of the most volatile stocks — is STEVEN MADDEN DL-,0001 there?
Today STEVEN MADDEN DL-,0001 has the market capitalization of 1.54 B, it has increased by 10.89% over the last week.
Yes, you can track STEVEN MADDEN DL-,0001 financials in yearly and quarterly reports right on TradingView.
STEVEN MADDEN DL-,0001 is going to release the next earnings report on Jul 23, 2025. Keep track of upcoming events with our Earnings Calendar.
SJM earnings for the last quarter are 0.55 EUR per share, whereas the estimation was 0.42 EUR resulting in a 32.50% surprise. The estimated earnings for the next quarter are 0.17 EUR per share. See more details about STEVEN MADDEN DL-,0001 earnings.
STEVEN MADDEN DL-,0001 revenue for the last quarter amounts to 509.67 M EUR, despite the estimated figure of 514.87 M EUR. In the next quarter, revenue is expected to reach 513.65 M EUR.
SJM net income for the last quarter is 37.36 M EUR, while the quarter before that showed 33.62 M EUR of net income which accounts for 11.15% change. Track more STEVEN MADDEN DL-,0001 financial stats to get the full picture.
Yes, SJM dividends are paid quarterly. The last dividend per share was 0.19 EUR. As of today, Dividend Yield (TTM)% is 3.52%. Tracking STEVEN MADDEN DL-,0001 dividends might help you take more informed decisions.
STEVEN MADDEN DL-,0001 dividend yield was 1.98% in 2024, and payout ratio reached 35.69%. The year before the numbers were 2.00% and 36.51% correspondingly. See high-dividend stocks and find more opportunities for your portfolio.
As of May 9, 2025, the company has 4.8 K employees. See our rating of the largest employees — is STEVEN MADDEN DL-,0001 on this list?
EBITDA measures a company's operating performance, its growth signifies an improvement in the efficiency of a company. STEVEN MADDEN DL-,0001 EBITDA is 223.59 M EUR, and current EBITDA margin is 11.30%. See more stats in STEVEN MADDEN DL-,0001 financial statements.
Like other stocks, SJM shares are traded on stock exchanges, e.g. Nasdaq, Nyse, Euronext, and the easiest way to buy them is through an online stock broker. To do this, you need to open an account and follow a broker's procedures, then start trading. You can trade STEVEN MADDEN DL-,0001 stock right from TradingView charts — choose your broker and connect to your account.
Investing in stocks requires a comprehensive research: you should carefully study all the available data, e.g. company's financials, related news, and its technical analysis. So STEVEN MADDEN DL-,0001 technincal analysis shows the buy rating today, and its 1 week rating is sell. Since market conditions are prone to changes, it's worth looking a bit further into the future — according to the 1 month rating STEVEN MADDEN DL-,0001 stock shows the sell signal. See more of STEVEN MADDEN DL-,0001 technicals for a more comprehensive analysis.
If you're still not sure, try looking for inspiration in our curated watchlists.
If you're still not sure, try looking for inspiration in our curated watchlists.