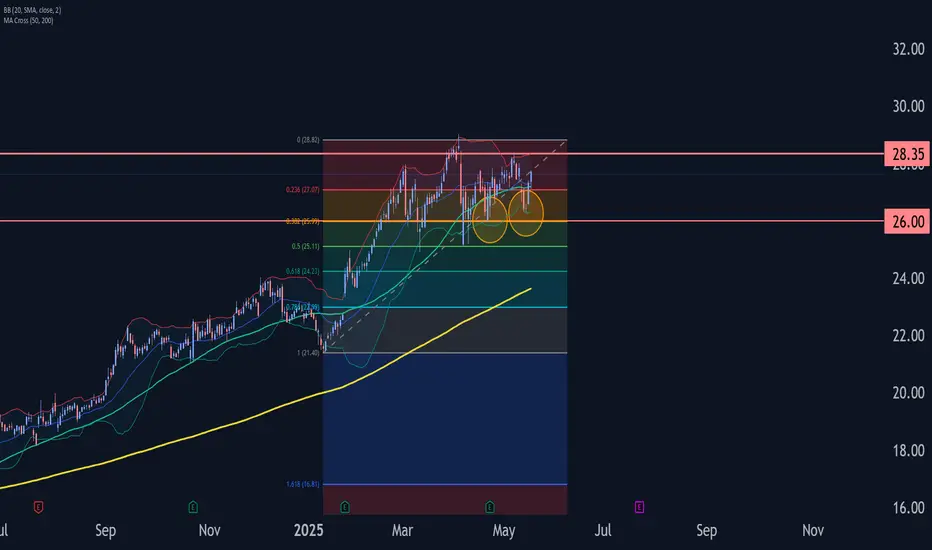
AT&T Wave Analysis – 16 May 2025- AT&T reversed from support zone
- Likely to rise to resistance level 28.35
AT&T recently reversed up with the daily Morning Star from the support zone between the key support level 26.00, 38.2% Fibonacci correction of the upward impulse from January and the lower daily Bollinger Band.
The active impulse wave iii belongs to the minor impulse wave 3 of the intermediate impulse wave (3) from the start of March.
Given the strong daily uptrend, AT&T can be expected to rise to the next resistance level 28.35, which reversed the previous impulse wave i.
SOBA trade ideas
AT&T I Tipping Point : Short Opportunity with Head & ShouldersHey traders after a previous trade trade on the hood hitting targets of 16.4%. Today I bring you NYSE:T
Technical + Fundamental View
Pro Tip
- Breakdown below the Entry Line will be considered at Trade Initiation. (Risky Traders)
R:R= 5.4
- Rest can follow entry at day close post breakdown SL above Entry Candle.
- The Breakdown Below the Entry Line will confirm the head and shoulder pattern
Entry Line - 26.93
Stoploss - 27.53
Target 1 - 25.59 (Neckline of head and shoulder)
Target 2 - 24.74
Target 3 - 23.68
Technical View
- Head And Shoulder on Daily Time frame
- On the hourly timeframe, the chart looks weak, showing a potential double top pattern where the second peak is lower than the first, indicating growing investor fear.
Fundamental View
- High Debt: Over $140 billion in debt limits investment capacity and consumes significant cash flow.
- Network Issues: Poor service quality and outages risk losing customers to competitors.
- Strong Competition : T-Mobile and Verizon offer better plans, making customer retention harder.
- Market Saturation: The U.S. wireless market is nearly saturated, limiting new customer growth.
- Execution Risks: Growth and debt reduction depend on flawless asset sales and network upgrades; delays could harm finances and stock performance.
Additional Considerations
- AT&T’s valuation is higher than some peers, potentially capping upside.
- Telecom market competitiveness means growth hinges on successful 5G and fiber rollouts.
- Dividend yield (~3.9%) is attractive but lower than some rivals, which may impact income investors.

T Trading Guide 4/21/25AT&T (T) Trading Analysis for Monday, April 21, 2025
Sentiment Analysis
-Overview: Sentiment on X and StockTwits is neutral, with investors appreciating T’s 4.11% dividend yield but expressing concerns over tariff-driven cost increases. Analyst consensus remains stable, with a “Hold” rating and a $21.50 target (April 20 ), though some Reddit (r/options) users highlight margin pressures from tariffs.
-Implication: Mixed sentiment suggests range-bound trading absent a catalyst, with tariff concerns capping upside potential.
Strategic Outlook
-Assessment: The outlook for Monday is neutral, supported by balanced options activity, oversold technicals with potential for a bounce, and a VIX at ~40 indicating volatility.
-Implication: Anticipate a price range of $26.50 to $27.50, with support at $26.50 likely to hold and resistance at $27.50 posing a challenge for bulls.
Market Influences
-Overview: No new Federal Reserve decisions today; recent guidance on April 17 signals caution on rates, potentially impacting telecom spending. T’s earnings are due April 23, with a consensus EPS of $0.52 (April 20 ). Social media chatter on X and WallStreetBets focuses on dividend stability, though some Reddit users note tariff risks (10% baseline). No M&A news has surfaced.
-Implication: Earnings anticipation and tariff pressures suggest cautious trading, likely keeping T within a tight range on Monday.
Price Context
-Overview: Current price at $27.15. The stock has declined 4% over the past month from $28.30 on March 31 and is up 13% year-over-year from $24.02 in April 2024. Support lies at $26.50, with resistance at $27.50.
-Implication: Recent declines indicate limited upside; a break below $26.50 could signal further downside to $26.00.
Technicals:
Monthly: RSI at 45 (neutral), Stochastic at ~40 (neutral), MFI at ~42 (neutral). Price below 10/20-month SMAs ($28.00/~$29.00, bearish).
Implication: Long-term bearish trend with neutral momentum.
Weekly: RSI at 42 (neutral), Stochastic at ~35 (neutral), MFI at ~38 (neutral). Price below 10/20-day SMAs ($27.50/~$28.00, bearish).
Implication: Bearish trend with neutral momentum, suggesting consolidation for weekly contracts.
Daily: RSI at 40 (neutral), Stochastic at ~30 (neutral), MFI at ~35 (neutral). Price below 10/20-day SMAs ($27.20/~$27.50, bearish).
Implication: Daily trend bearish, but oversold conditions may support a bounce.
4-Hour: RSI at 43 (neutral), Stochastic at ~38 (neutral), MFI at ~40 (neutral). Price below 10/20-period SMAs ($27.10/~$27.20, bearish).
Implication: Medium-term bias bearish, aligning with weekly caution.
Hourly: RSI at 46 (neutral), Stochastic at ~42 (neutral), MFI at ~44 (neutral). Price below 10/20-hour SMAs ($27.05/~$27.10, bearish).
Implication: Intraday bias bearish, suggesting potential selling pressure.
10-Minute: RSI at 48 (neutral), Stochastic at ~45 (neutral), MFI at ~46 (neutral). Price below 10/20-period SMAs ($27.00/~$27.05, bearish).
Implication: Short-term bias bearish, supporting a cautious weekly stance.
Options Positioning
Overview: Weekly options show balanced volume ($27.00 calls: 800 contracts, 50% at ask; $26.50 puts: 900 contracts, 55% at bid), with a put-call ratio of 1.1 (neutral) and IV skew flat ($27.00 calls/puts: 35%). Monthly options have a put-call ratio of 1.0, IV flat ($27.00: 32%). 3-Month options show a put-call ratio of 1.2, IV flat ($26.50: 30%). VIX at ~40 (down 5%, above 30-day average of ~35).
Option Flow Dynamics (OFD) Analysis:
Vanna:
-Impact: Minimal, ±$0.02 intraday.
-Insight: Balanced call/put volume and flat IV skew at 35% result in negligible delta adjustments by dealers, even with a VIX of 40.
-Stance: Neutral for weekly contracts; bullish if IV exceeds 38%.
Charm:
-Impact: Pins price ±$0.02, minimal volatility.
-Insight: High open interest at $27.00 (calls: 2,000 contracts, puts: 2,200 contracts) leads dealers to maintain delta neutrality, pinning the price near expiry.
-Stance: Neutral for weekly contracts; bearish if price breaks above $27.50.
GEX (Gamma Exposure):
-Impact: Pins price ±$0.05, minimal volatility.
-Insight: Balanced gamma from equal call/put open interest at $27.00 keeps price stable, though a VIX of 40 could amplify breakout volatility.
-Stance: Neutral at $27.15 for weekly contracts; bearish above $27.50.
DEX (Delta Exposure):
-Impact: No directional bias.
-Insight: A put-call ratio of 1.1 indicates balanced delta exposure, with dealers’ hedging activities netting zero directional impact.
-Stance: Neutral for weekly contracts, even on high volume.
OFD Summary: Weekly flows indicate a neutral bias, with price likely to remain within $26.50-$27.50, driven by balanced Vanna, Charm, GEX, and DEX dynamics. A VIX of 40 suggests potential volatility; earnings on April 23 could push IV above 38%, adding $0.05-$0.10 upside (Vanna). Monthly and 3-month expiries (put-call ratios 1.0 and 1.2) confirm range-bound confluence.
-Implication: Neutral bias for weekly contracts; high VIX suggests volatility within the $26.50-$27.50 range for Monday.
ICT/SMT Analysis
-Overview: Weekly: Neutral, support at $26.50, resistance at $27.50, SMT divergence versus VZ shows relative strength. Daily: Neutral, FVG $27.50-$28.00, OB $26.00. 4-Hour: Neutral, MSS below $27.15, liquidity below $26.50. 1-Hour: Neutral, MSS below $27.15, liquidity below $26.50. 10-Minute: OTE sell zone $27.20-$27.30 (Fib 70.5%), target $26.50.
-Implication: Neutral across timeframes; a breakdown below $26.50 could target $26.00, but weekly contracts are likely to see consolidation.
Edge Insights
-Institutional Flows: Recent block trades (April 18 ) show balanced buying and selling at $27.00, suggesting institutions are hedging rather than taking a directional stance.
-Sector Stability: Telecom sector is down only 5% YTD (Morningstar ), providing relative stability compared to other sectors, though tariff costs remain a headwind for T.
-Earnings Catalyst: With earnings due April 23, pre-earnings positioning may increase volatility, potentially favoring a breakout above $27.50 if sentiment shifts positively.
-Implication: Sector stability supports a neutral weekly stance, but monitor for pre-earnings IV spikes that could shift dynamics.
Trade Recommendation Analysis:
-Neutral: 50% likelihood (balanced options flows, GEX pinning at $27.15, high VIX choppiness).
-Bearish: 30% likelihood (MSS below $27.15, tariff pressures).
-Bullish: 20% likelihood (oversold indicators, potential bounce above $27.50).
-Action: Recommend a neutral stance with a bearish tilt; if bearish, buy $27.00 puts (weekly expiry) at ~$0.20, targeting $0.40, with a stop at $0.10 if T breaks $27.50. Risk $40 (2% of a $2,000 account).
Conclusion for Monday: T is poised for range-bound trading within $26.50-$27.50, driven by neutral options flows and tariff concerns. Focus on a potential breakdown below $26.50 for weekly bearish trades, targeting $26.00. High VIX and impending earnings add risk—execute with tight stops to manage volatility.

T Trade LevelsYou might notice that this is the Hourly timeframe.
For a ticker that moves 0.83 cents/day, I just needed to know the directional bias up top (ranging but leaning bullish).
I would expect day trades to move level to level.
The contracts listed will be your best options whether day or swing trading.

New Setup: TT : I have a swing trade setup signal. Looking to enter long if the stock can manage to CLOSE above the last candle high(BUY). If triggered, I will then place a stop-loss below (SL) and a price target above it(TP Zone) **Note: This setups will remain valid until the stock CLOSES BELOW my stop-loss level(SL).

Quantum's T (AT&T) Trading Guide 4/13/25Sentiment: Neutral. Dividend yield (4-5%) and debt reduction ($123B) attract income seekers, but telecom competition and tariff fears limit enthusiasm. X posts praise stability, though growth concerns persist.
Outlook: Neutral, slightly bullish. Options pin $27, with call buying eyeing $28. ICT/SMT supports $26-$26.50 buys to $27.50-$28 if support holds. Bearish risk below $25 low unless earnings falter.
Influential News:
--Federal Reserve: Rates unchanged, two 2025 cuts expected, easing debt costs. Liquidity boost mildly positive.
--Earnings: Q1 due April 23 (EPS $1.97-$2.07 vs. $2.13). Fiber (28.9M locations) and cash flow (>$16B) could lift if beat.
--Chatter: X mixed—stability vs. tariff risks. Analyst focus on earnings revisions.
--Mergers and Acquisitions (M&A): Talks to acquire Lumen’s fiber unit ($5.5B+), potentially boosting growth but risking debt concerns.
--Other: Tariffs caused volatility; RUS:T stable. Broadband expansion adds value.
Indicators:
--Weekly:
----RSI: ~45 (neutral).
----Stochastic: ~50 (neutral).
----MFI: ~40 (neutral).
----SMAs: 10-day ~$27.10 (below, bearish), 20-day ~$27.30 (below, bearish).
----Interpretation: Neutral, bearish SMA signals suggest consolidation.
--Daily:
----RSI: ~48 (neutral).
----Stochastic: ~55 (neutral).
----MFI: ~45 (neutral).
----SMAs: 10-day ~$27.10 (below, bearish), 20-day ~$27.30 (below, bearish).
----Interpretation: Neutral, bearish SMAs indicate pullback but recovery possible.
--Hourly:
----RSI: ~50 (neutral).
----Stochastic: ~60 (neutral).
----MFI: ~50 (neutral).
----SMAs: 10-day ~$27.10 (below, bearish), 20-day ~$27.30 (below, bearish).
----Interpretation: Neutral, mildly bullish momentum.
Price Context: $26.79 (April 11 close), 1M: -6%, 1Y: +59%. Range $25-$29, holding $26 support amid tariff concerns.
Options Positioning (May 2025):
-Volume:
----Calls: $27 (3,500, 60% ask = buying), $28 (2,500, 55% ask). Bullish bets on $27-$28.
---Puts: $25 (2,000, 70% bid = selling), $26 (1,500, 65% bid). $25 put selling supports $26 floor.
-Open Interest:
---Calls: $27 (10,000, +2,000 = buying), $28 (7,000, +1,500). Institutional bullishness.
---Puts: $25 (4,000, flat), $26 (6,000, +1,000). Hedging, not bearish. Put-call ~0.9.
-IV Skew:
---Calls: $27 (25%), $28 (27%, up 2%). $28 IV rise shows $28+ speculation.
---Puts: $25 (22%, down 1%), $26 (24%). Falling $25 IV reinforces $26 support.
-Probability: 60% $25-$28, 20% >$29.
Karsan’s Interpretation:
---Vanna: Neutral (~50k shares/1% IV). Stable IV limits flows; earnings IV spike could push
$27.50.
---Charm: Neutral (~20k shares/day). Pins $27.
---GEX: +20,000. Dealers sell $28, buy $26, holding range.
---DEX: +1M shares, neutral.
---Karsan view: GEX pins $26-$28; catalyst needed.
ICT/SMT Analysis:
--Weekly: Neutral, $25 support, $29 resistance. No $T/ NYSE:VZ divergence (~$43 NYSE:VZ ).
--Daily: Bullish at $26 FVG, targets $28. Bearish < $26.
--1-Hour: Bullish >$26.50, $27.50 target. MSS at $26.50.
--10-Minute: OTE ($26.69-$26.80, $26.73) for buys, NY AM (8:30-11:00 AM).
Trade Idea:
---Bullish: 60%. ICT/SMT buys $26-$26.50 to $27.50-$28 (OTE $26.73). Options favor $27-$28
calls. Earnings, M&A, Fed cuts support.
---Neutral: 30%. RSI (~45), SMAs (bearish), $25-$29 range, balanced options (put-call ~0.9).
---Bearish: 10%. Below $25 needs earnings miss. Low $25 put volume.

Quantum's T (AT&T) Trading Guide 4/11/25T (AT&T Inc.)
Sentiment
• Sentiment is neutral with a bearish tilt. April 10 options activity shows put-heavy volume at $26 strikes, reflecting caution. RSI (14) at ~50 (estimated, flat trend at $26.40 close) suggests indecision. X posts highlight concerns over telecom debt loads and tariff risks on equipment imports, but some speculate on institutional accumulation below $26.50. A liquidity sweep below $26.33 could trigger a bullish reversal if buy-side liquidity is tapped.
Catalyst: Potential sweep below $26.33 may spark short covering.
Tariff Impact - Rating: Moderate.
• Explanation: T relies on imported telecom equipment, facing cost pressures from tariffs on China (active as of April 11). No relief announced, so margins could tighten, capping upside. X posts suggest tariff fears weigh on sentiment, but domestic revenue focus limits fundamental damage.
News/Catalysts
• Driver: Flat telecom sector performance on April 10, with T holding steady amid mixed market signals. X posts cited stability but no clear catalyst.
• Upcoming: CPI (April 11): High CPI could hurt T (-1.5%) due to rate hike fears; low CPI may lift it (+1%) as a yield play.
• Retail Sales (April 15): Strong data supports T (+1%); weak data pressures (-1%) due to consumer spending risks.
Technical Setup
Weekly Chart:
• HVN: $26.00 support (bullish).
• LVN: $27.00 resistance (neutral).
• EMA Trend: 8-week ≈ 13-week > 48-week (neutral).
• RSI (14): ~50 (neutral).
• MACD: Near signal line (neutral).
• Bollinger Bands: At midline (neutral).
• Donchian Channels: At midline (neutral).
• Williams %R: ~-50 (neutral).
• ADR: Stable (neutral).
• VWAP: At VWAP $26.40 (neutral).
• ICT/SMC: No clear MSS; consolidation phase.
One-Hour Chart:
• Support/Resistance: Support at $26.33; resistance at $26.56. Stance: neutral.
• RSI (14): ~50 (neutral).
• MACD: Near zero (neutral).
• Bollinger Bands: At midline (neutral).
• Donchian Channels: At midline (neutral).
• Williams %R: ~-50 (neutral).
• VWAP: At VWAP $26.50 (neutral).
• ICT/SMC: Sell-side liquidity below $26.33; OB at $26.40; FVG at $26.35–$26.45; OTE at $26.45; no displacement.
10-Minute Chart:
• Closing Move: Flat into close.
• EMA Direction: 8/13/48 EMAs flat (neutral).
• RSI (14): ~50 (neutral).
• MACD: Near zero (neutral).
• VWAP: At VWAP $26.50 (neutral).
• ICT/SMC: Potential sweep below $26.33; OTE at $26.45; no clear entry signal yet.
Options Data
• GEX: Neutral, pinning at $26.50. Dealers hedge minimally.
• DEX: Put delta bias (-0.15), bearish pressure.
• IV: Low (~18%), limited swings.
• OI: Put-heavy (55% puts at $26), capping upside.
Cem Karsan’s Application:
• Weekly Trading Breakdown: OI at $26 suggests pinning. Low gamma limits volatility; vanna neutral; charm favors puts near OPEX.
• Strategy: Buy $26.50 calls at $26.45 (OTE), exit at $27, profit $0.30, risk $0.40. Ties to sweep below $26.33.
• Vanna: Stable IV, no dealer-driven lift.
• Charm: Puts gain delta near OPEX, pressuring $26.
Timeframe Analysis:
• Weekly (exp. April 18): Put OI at $26, low IV, bearish stance.
• Monthly (exp. May 16): Balanced OI, neutral stance.
• 3-Month (exp. July 18): Neutral outlook.
• Directional Bias: Neutral, leaning bearish unless sweep triggers reversal.
Sympathy Plays
• Correlated Assets: VZ (+1%), CCI (+0.5%).
• Opposite Mover: If T fades, risk-on SPOT rises (+1%).
Sector Positioning with RRG - Sector: Communication Services – Telecom.
• RRG Position: Lagging vs. XLC, reflecting weak momentum.
Targets
• Bullish: +2% to $27.00 (OB).
• Bearish: -2% to $25.87 (FVG).

THERE IS A POTENTIAL BREAKOUT TO THE UPSIDE IN T[AT&T]As we can see market overall is bull due to creation of higher low and higher high, at the moment market is making a pullback before continuing with its direction to the upside. we are looking for long opportunity in this pullback. keep monitoring from one hour.

T: In the meantime, making some heavy stridesAT&T is not something we see in the finance news that often nor has the sexiness of the Silicon Valley names, but, since July of 2023, this company has been on a tier. Seem like the new CEO knows what he's doing and combined with missteps from the competitors, T has seen a 100% move up from the bottom. At the moment a bounce is most likely incoming along with the general markets. But after that I would expect another leg down to 0.764 fib level or a bit lower to confirm support and then move up from there. At some point this stock could be one of the best defensive names if overall economy slides into a recession.

AT&T 1 Month Chart Technical Analysis
Chart Pattern: Bull flag(bullish) broke upwards following upward trend line(green).
Exponential Moving Average: EMA 9(green line) is above EMA 21(red line) bullish
Bollinger Band (BB): AT&T is in the upper band(red) it could be bearish, however, let’s check the volume to make sure this isn’t signifying a reversal downwards.
Moving Average Convergence Divergence: The MACD (green line) is above the signal (red line) bullish.
Volume: The volume for last month (Monday 3, Feb 2025) is higher than this month's volume (Monday 3, Mar 2025). Granted, we’re only nine days in this month.
Red Rectangular Box: AT&T is in a zone where the most bearish activity or choppiness is.
Opinion: Bullish on the 1-month chart. Everything related to the chart looks promising. The volume will come as the month progresses. If AT&T closes above my trendline $28.04, I see it going to my next target $29.72 and potentially $32.35.
Out of the money options (OTM): Calls for 18 Jul 25 100
0.63 x 100= $63.00

AT&T Wave Analysis – 18 February 2025
- AT&T broke the resistance zone
- Likely to rise to resistance level 27.00
AT&T recently broke through the resistance zone at the intersection of the long-term resistance level 25.00 (which has been reversing the price from 2020) and the resistance trendline of the daily up channel from 2024.
The breakout of this resistance zone accelerated the active medium-term impulse wave (3) from the start of January.
AT&T can be expected to rise to the next resistance level 27.00 (target price for the completion of the active impulse wave (3)).

Speculative Madness: The Market’s Bubble Stocks Some stocks areSpeculative Madness: The Market’s Bubble Stocks
Some stocks aren't just overvalued—they're in full speculative bubble mode. Fundamentals? Irrelevant. When euphoria takes over, rationality disappears.
Here’s my list of bubble stocks that scream unsustainable pricing:
SBUX, T, PLTR, BMY, PYPL, NFLX, GS, ISRG, ARM, C, SHOP, BSX, SPOT, UBS, IBKR, RELX, CEG, CRWD, MSTR, MMM, DASH, COF...
And let’s not forget the obvious: TSLA, META, AMZN, AVGO, GOOGL, JPM, MA, V, WMT.
Honestly, the entire banking sector, brokers, and tech are in bubble territory.
What the hell is going on with this market? Why are algos just buying, buying, buying, squeezing all the shorts?! Unbelievable.
The dump will be insannnnnnnne!!! 🚨

AT&T Wave Analysis – 31 January 2025
- AT&T reversed from long-term resistance level 25.00
- Likely to fall to support level 23.00.
AT&T is under the bearish pressure after the price failed to break above the long-term resistance level 25.00 (which has been reversing the price from the start of 2020), standing above the upper weekly Bollinger Band.
The downward reversal from the resistance level 25.00 will likely form the weekly Shooting Star (strong sell signal for AT&T) – if the price closes this week near the current levels.
Given the strength of the resistance level 25.00, AT&T can be expected to fall to the next support level 23.00.

AT&T Macro Bull FlagLots of potential upside for this telco. Potentially forming a massive bull flag.
Do you see a different pattern forming?
I suppose this would be a buy and hold as this would take 10 years to play out.
Time in the market is better than timing the market.


AT&T setup is wired!AT&T - NYSE:T
5% Dividend yield and about to pop higher?!
Setup looks wired 🛜
Breakout = 🎯$24🎯25.38
Not financial advice

Continuation buys based of hourly timeframe . Based off hourly fib the 61.8% PRZ level lines up with an hour zone of structure. I think this could be the possible HL needed for entry

Short term buys based off hourly structureAfter pullback to 61.8% PRZ lvl / pullback to hour trend line. After price pulls back to these levels I expect a higher low to be formed and the uptrend to continue

T: Distribution rangeT: Distribution range
-Quasimodo pattern.
-Change of Characte on Daily TF.
-Bactest to determine the demand: first day with Green candle with low volume- a good signals.
-Wait for more backtest to 22.17 zone, if small continuous demand volume, we can have a put entry 22.17 zone (at fibo retracement golden zone), with stop loss above key level, and target as attached.
.
Wait n see!
-

AT&T on course for $93b / -60% correction?On the above 3 month chart price action has rallied 70% since July 2023 for no reason whatsoever on this loss making company. A phone company picks a finance guru to run a business that relies on creativity. What could go wrong?
Regardless, short term liabilities are almost 2 fold the assets with net income in loss, -$174m last quarter alone. Before consideration of the $146b debt.. how is this business even paying a dividend?! A master of finance this guru is, but let us not question the era corporate America is operating these days. (Boeing says hello.... hell with engineers, what do they know?!)
Despite this the market is bullish.
Morningstar (December 4th, 2024)
“With Room to Sharply Increase Broadband Margins, We’ve Increased Our AT&T Fair Value Estimate to $25”
“Results were solid, with strong wireless customer churn pushing net customer additions”
The Motley fool (November 6th, 2024)
“AT&T has returned its focus to its core operations, and those businesses are steadily strengthening. That, coupled with its debt reduction and rising FCF, makes AT&T look like a worthwhile long-term investment.”
Tradingview.com ideas are mostly all long ideas.. people!
The TA:
On the above 3 month chart:
1) Price action and RSI support breakouts.
2) Regular bearish divergence.
3) Rising wedge breakout, which forecasts the first 40% correction.
4) The larger uptrend channel forecasts the complete 60% correction to monthly support of around $9.
Is it possible price action continues upwards and onwards? Sure.
Is it probable? No.
Ww

AT&T strong bullish expectations here
AT&T zone breaked, in last periods bearish market, now what we can expect is change in this market,- strong indications for bullish continuation.
TP1: 25
TP2: 28

AT&T stock looks bullish nowHi Traders
AT&T Inc (T) is in an uptrend since August ’23. The price level broke the resistance of $21.3 and seems to confirm the fact that the old resistance level serves as a support level right now. I suspect the stock to make new higher highs as long as the uptrend doesn’t get invalidated. In other words, if the stock price doesn’t fall below it’s support range between $21.2 and $22.8. We can, thus, see this range as the buy area.
Also in terms of fundamental analysis, there is something to say about this stock. Shares of AT&T have gained 28.7% in the past six months, outperforming the Zacks Wireless - National industry, which has returned 25.4% over the same period. Per the Zacks analyst, the company is likely to gain from increased deployment of mid-band spectrum, along with greater fiber densification. The planned commercial-scale open radio access network across the country will additionally help it build a more robust ecosystem of network infrastructure providers and suppliers. Therefore, the stock seems bullish.
Entry this trade in the price range of $21.2 - $22.8
stop loss at $20.85
and target a share price of $27.65.
2 possible scenarios are shown on the chart
Good luck

$T with a bullish outlook following its earnings #StocksThe PEAD projected a bullish outlook for NYSE:T after a positive under reaction following its earnings release placing the stock in drift A with an expected accuracy of 100%.
