4/14 TT is kinda slow so I post the weekly chart.
(1) Soon to exit the triangle zone (pink line)
(2) support at 27.49 steady
(3) should not be a problem to reach 31 or even higher until inside pink line.
(4) if it broke out the while pink triangle zone, scale in and hold.
SOBA trade ideas

AT&T (T)Restructuring savings and lower interest expenses should give support to margins, setting a rally in EPS to $3.30 in 2022 and around $3.90 by 2025. AT&T is very interesting as a yield (7.0%) play for income-focused
investors.


BULLISH MOMENTUMHELLO TRADER'S THIS IS MY BULLISH TREND ANALYZE . WAIT FOR COME KEY LEVEL AFTER TREND CONTINUE TO UPTREND YOU CAN ENTRY .THIS IS MY OPINION ONLY NO MORE SIGNAL .

$T Potential path to $39If we aren't able to break this trendline, i expect we'll come back down to ~28 before we finally clear this symmetrical triangle that has been forming since last February.
Once that triangle pattern is broken and we have a clear breakout, i expect we'll reach close to the top of this pitchfork at around $35 perhaps by EoY. This is also the median of the channel that has been forming for the past 2 decades. From there we can head back to pre covid highs at around $39 by mid to late 2022 perhaps?

ATT Potential for equal and opposite reactions into May. HBOMax Long setup. really did nothing since March selloff. Now forming inverse head and shoulders bottom as HBOMax is picking up subs.
YOLO Alert

Squeeze Incoming; 2.5 dtc A comp of $T and $VZ's stock. Similar setups, with VZ blazing ahead. $T seems a day behind. You can never be confident when playing short-term moves, but you can see the squeeze indicator Ppppin off prior to VZs move and it's doing it for T now. The rotation favors it, and it looks like some shorts might not have closed fast enough.
www.marketbeat.com
It's enough to place a small bet upon. I'm not a squeeze-hunter, but when it seems to be happening it's good to take a small position.

AT&T pushing to the 31.91 ResistantAT&T may arrive at the 31.91 resistant in the upcoming days. In this negative skewed volume environment, the majority of investors are concentrated on the previous week's close. This is an indicator of strength. It is, however, important to wait for confirmation. If the 31.91 l is broken, we can expect the price to rise to the next resistance level of 35, as investors keep on buying due to the optimistic TA.
Follow me in Etoro for more updates!
Dreguero


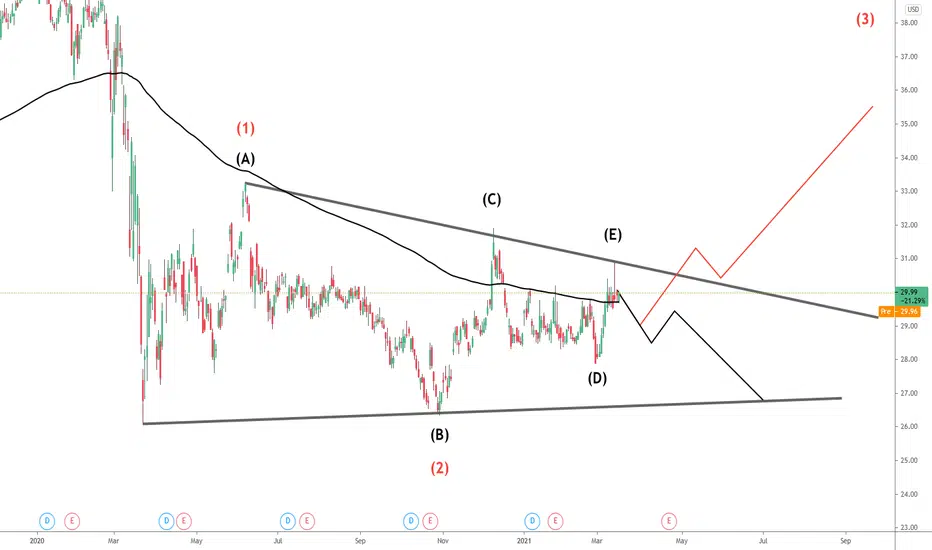
T - Elliott Wave update Previous Analysis of wave 2 (blue) was anticipated too early.
Lower degree of wave & was completed (magenta). Wave impulse upward should be underway
New target is 36.82 where wave 3 (blue) reaches 1.618 of wave 1(blue).

AT&T Is one of the most undevalued stock during this timeHere is one of the most undervalued stocks which is AT&T. Its price is 30$ and its intrinsic value is 109 $. So I believe this stock even if the market did not appreciate it yet, eventually will go toward its fair value.


Positive trends with new strategyBased on the Options Flow and other technical indicators (penant building) we can see clear bullish properties.
The recent change in strategies by John Stankey + Jason Kilar coupled with the increased insider buying ( while competition T-Mobile increased in insider selling!) hint to a possible explosive upward movement. ( + whales buying insane amount of calls )
At time of publishing:
T: Price to Book (FY) 1.3218 / Gross Profit (FY) 63.324B
T-Mobile: Price to Book (FY) 2.3966 / Gross Profit (FY) 26.632B
VZ: Price to Book (FY) 3.4518 / Gross Profit (FY) 60.371B
Price target: $38


T - It may go up or it may go down :)(if it doesn´t go sideways)
We´re in no man´s land right now, and no trades should be taken. But I´m bullish (RED scenario) based on impulsive (B->C) x corrective (C->D) movements. Will only go long if trendline is broken.
Traditional|T|Long and shortLong and short T
Activation of the transaction only when the blue zone is fixed/broken.
Working out the support and resistance levels of the consolidation zone.
* Possible closing of a trade before reaching the take/stop zone.
The "forecast" tool is used for more noticeable display of % (for the place of the usual % scale) of the price change, I do not put the date and time of the transaction, only %.
The breakdown of the upper blue zone - long.
Breakdown of the lower blue zone - short.
Working out the stop when the price returns to the level after activation + fixing in the red zone.
Blue zones - activation zones.
Green zone - take zone.
Red zone - stop zone (S-SL short stop, L-SL long stop).
Orange arrows indicate the direction of the take.
Red arrows indicate the direction of the stop.
P.S Please use RM (risk management) and MM (money management) if you decide to use my ideas, there will always be unprofitable ideas, this will definitely happen, the goal of the system is that there will be more profitable ideas at a distance.


$T with a bearish outlook following its earnings #StocksThe PEAD projected a bearish outlook following a negative under reaction after its earnings release placing the stock in drift D
If you would like to see the Drift for another stock please message us. Also click on the Like Button if this was useful and follow us or join us.

HBO Max will turn T into a growth stonkBuy Att on HBO Growth prospects and get paid the insane divy while you wait

$T Symm.Triangle Breakout vs Fakeout?Hello Everyone!
I recently had a successful play on ATT purchasing some calls before this past weeks uptrend on $T
Unfortunately, since I didn't enter the trade with any real, calculated goal targeted, the position was exited once I saw an enticing percentage of gains.
While I'm overall happy with the results, I couldn't help but notice the disappointment in myself as the price on the calls continued to rise even more after I sold them, knowing I could've quite
easily returned even more from the position.
So I've pulled up AT&T to get a closer look to see if I can identify any other clear opportunities on a new position.
If things play out along with my idea, I'll enter a new position and this time with a more calculated plan- as is my main trading goal for this new year.
To trade with more calculated entries and target goals to exit & improve accordingly.
$T seems to be bouncing within a more symmetrical triangle pattern, with no real success breaking out- as noted by the circles marking the failed attempts.
Personally I'm predicting that with some of the new business strategies AT&T is aggressively taking on recently, we could see some buyer confidence based off of those fundamentals. This could support the possibility of finally breaking out of this Symmetrical Triangle. We also seem to be retesting the resistance more than the support.
If price breaks above the horizontal line (marked BULLISH), a pullback using that line as new support would be a great point for an entry. The top of that green arrow marks the target, slightly under $37
While watching this play out, I'm considering if taking on this move in the form of going long on both shares & some Options calls would be a strong move?
That play would require some closer consideration to avoid over exposure to risk.
I say that, because at this point it seems equally telling that ATT could continue downward, especially if resistance holds on a retest and buyer confidence weakens.
I've laid out the 50 MA (thicker white band) & the 20 MA (thinner yellowish band)
the 50 MA will help as a tool to plot safe stop losses without being too overprotective of the position resulting in getting stop'd out.
I'll try to update on which way my view of this potential plan plays out on this idea.
Please feel free to give friendly but honest critiques!
Happy Trading!
*this is not financial advice*
**all my charts are for educational & personal tracking purposes**

Buyers giving up? Declining OBVI'm long AT&T and personally think anything under $30 is a discount, but something interesting is forming here....
Been trading sideways since New Years Day with crystal clear resistance and support lines, though OBV has been declining significantly, so red days are seeing much higher action.
Is this a sign of bulls getting tired?
Options volume for Mar19 is through the roof, so big money is definitely expecting a move here of some sort.
Thoughts?

AtntI don't really need to go too into detail. Everybody knows this stock has some explaining to do....I think I caught price action.
The three major U.S. wireless companies spent heavily at a recent wireless-spectrum auction that raked in a record $81.2 billion and is expected to dramatically reshape the telecommunications industry for years to come.
1. Verizon Communications Inc. VZ, 0.72% was the biggest bidder in the auction for “C-band spectrum,” a type of wireless spectrum that the biggest U.S. carriers expect will prove crucial in the rollout of 5G networks. Verizon spent $45.5 billion at the auction, while AT&T Inc. T, 1.56% spent $23.4 billion and T-Mobile US Inc. TMUS, 2.76% spent $9.3 billion. Others rounded out the auction with smaller bids of their own — U.S. Cellular Corp.’s USM, 1.60% $1.3 billion haul was the next largest total after T-Mobile’s.
2. AT&T Inc. will offload its DirecTV operations in a deal with private equity firm TPG that values the business at about $16 billion, a fraction of what the telecom giant paid for the satellite-TV company in 2015.
The move caps years of AT&T deliberating over what to do with DirecTV, a pay-television pioneer that had increasingly become a burden as it hemorrhaged customers.
As part of the agreement, a joint venture with TPG will run DirecTV and AT&T’s other pay-TV operations, the companies said Thursday. AT&T will get $7.6 billion in cash from the transaction, with the new DirecTV taking on $5.8 billion in committed debt financing.
....Warner Bros.....Space Jam hasn't been released yet, Kong vs Godzilla, Tom n Jerry Movie just debuted with 13.7 MIL.....great dividend....I'll option trading this one for a while.
Let me know what you think?
Like, Follow, Agree, Disagree!
*not investing advice
