AT&T possible final 5th wave daily and weekly upAnticipating a possible move up in AT&T (T) to 44.50 mirror projection based on preceding milestones and 4th wave lows.
Or the Rally is over and look out below for targets below 31.
There is a pretty clear EW set of outcomes for this situation from process of elimination.
Either I've counted wrong or there's one more leg up.
Pros:
Clear preceding Impulse pattern UP
Decline in 3 waves
Possible EW count with 5th wave remaining.
Weekly timeframe mirror projection exceeded in Orange box.
Daily timeframe mirror projection not achieved yet as wave 5 target 44.50.
Price at Upper Fib cluster at 40.59 using the wave b (as labeled) high for a starting milestone.
Secondary Lower Fib cluster at 39.65 sitting right at the wave (3) highs
In a 3 wave geometric channel from the preceding wave 4 of one lesser degree.
Oscillators making hourly Bullish W patterns.
Cons:
RSI clearly in Bearish territory on Daily chart.
Current momentum signature and hourly pattern, and EW rules show that
price can fall as low as 39.20 before invalidating a Bullish outlook
which is questionable Risk control.
Trade:
Long 41.80 to 44.50
Given the possible pattern outcomes from what is currently showing:
Anticipate that Price breaks the Red channel mid line to the Upside.
Or it breaks below 39.65 and keeps going below 31.
Alt count is in Teal color Roman. I see this as less probable because wave v in this scenario did not make a new high and leaves an unbalanced 7 waves up in the last rally into the highs when viewed on the 2 hour chart.
Momentum and larger proportion of the current correction are Ugly at the moment, but the fact that it's finding support at the upper Fib cluster with respect of that Red channel drawn from the preceding 4th is something that jumps out at me.
SOBA trade ideas

DTI8 Posicion LargaHay una tendencia alcista desde hace unas semanas, esto apoyando con un analisis de medias mobiles y MACD me lleva a tomar una posicion larga en AT&T. A pesar de eso hay que ser conservador ya que el mismo MACD muestra que la tendencia lentamente se va revirtiendo pero todavia se puede obtener un rendimiento al alza.


Double Top Coming!Check out the debt on AT&T's balance sheet! No good if rates go up! Short term long, however.

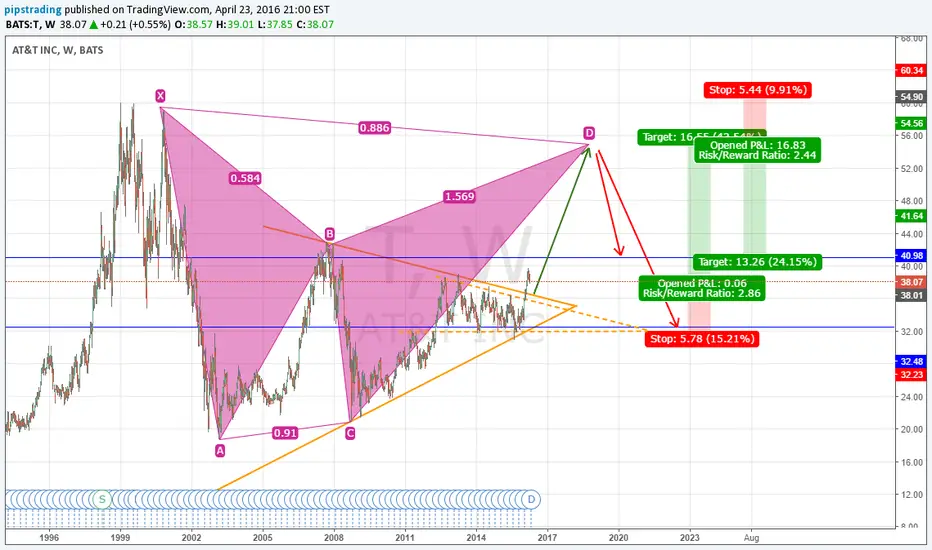
T Bearish CrabWhen I see BIG BEARISH PATTERNS ACROSS THE BOARD as this chart of a Bearish Crab in AT&T (T), I am defensive! Many others in Dow Industrials!


Do not trust the unconfirmed hammerPossible outbreak, or trend break at the lower end of the hammer..


AT&T - Short withing a rangeRanges are probably the easiest to trade, you have a ceiling and a floor all you have to do is go long or short around them. Oscillators can be a big help, take for example the Force Index, which when it got out of its bands, it predicted with high accuracy a move in the opposite direction.
I outlined two trades on the chart, along with my explanations.
On the daily chart there is a minor H&S which got its neckline broken, so two time frames align.

Waiting to enter this short trade/Will take next level as wellWaiting to enter this short trade/Will take next level as well

AT&T head and shoulders - confirmedtwo days after HAS confirmation, but the price is still around entry point, there is quite limited space for decline, two weekly supports around 36-37!

Long AT&T, hold till end of 2018, target $54, with 5% dividend AT&T seems to be in consolidation since mid 2012.
The recent 2 month rally broke the downward triangle upper bound. it may move down to retest the upper bound first before another rally. Anyway, current spot price of $38 is still a good price to buy since the dividend yield is a decent 5%!
A good retirement stock.

T: bullish engulfing candle on bull pullbackStrong technicals on AT&T for a gradual upward movement. Stop under the channel and 20 SMA, target at even 40.

Short AT&T?- Looking at a longer term 1W chart here. Price has been ranging for the last 4 years. AT&T is approaching the top of it's range and historical resistance. The next major resistance level is at the 42.50 price level.
- Waiting 2-4 weeks to see what happens. Watching if price can break this range or if it will roll over. I think price is going to roll over but we'll see.


T - wait for PUTWatch T for PUT position when below 31.77, SL 32.3
- 1st target 30.98
- 2nd target 29.86

Short ATT? With Pleasure!AT&T is a terrible, clandestine company and they deserve to fail. This is not the reason I am shorting them, however.
Since the downgrade on 10/09 the stock seems to have trouble achieving and maintaining new levels. Furthermore, the Ichimoku cloud indicates some resistance from above at 35.63 or so, there is a lot of room to spare before we reach that level. The OBV indicator tells us that there is decreased buying pressure, and the MACD has recently crossed over. Finally the RSI confirms that this is a 'sweet spot' to make a trade.
For intermediary profit targets consider the two levels drawn from the lows going back to early October at 33.18 and 33.00, but note that after that, its smooth sailing through the vacuum area to the high of 10/02 at around 32.61. Stop losses may be set analogously using the relative high at 33.73, the Ichimoku cloud at 33.63, or if it crosses over the line segment forming the upper bound of the wedge.

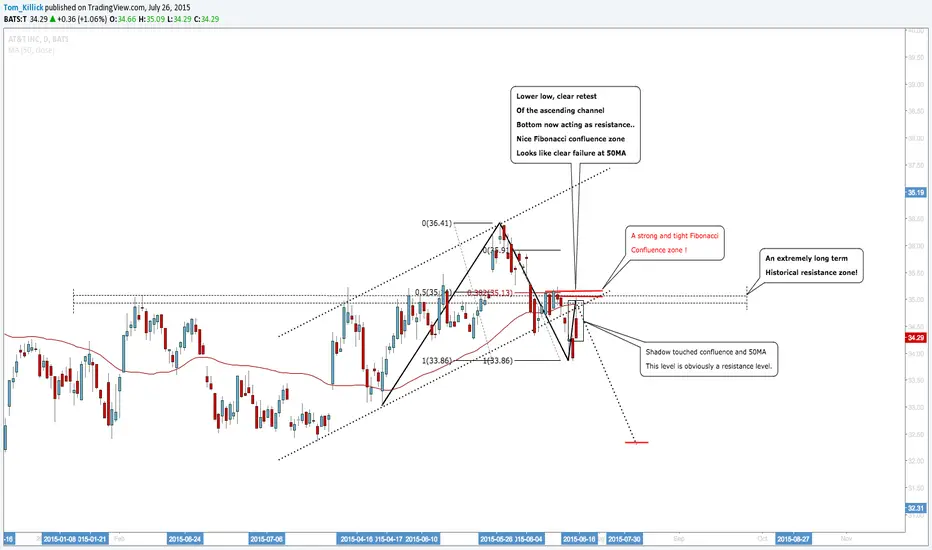
AT&T: Expecting To See Very Strong Selling From This Level !!Friends
AT&T looks good for a short, anyone who's got me on snapchat has heard me excited about this stock all weekend. I think the short from here will be aggressive and merciless.
Best of luck
Tom
--For latest ideas, stock picks and opinions, please add me on my Snapchat: T_Killick
Bullish Crossover Could Send AT&T to 42.50Breaking through this wedge could send AT&T's stock to about 38.50 in the short-term and about 42.50 in the long-term. The 50 day MA is in the process of crossing over the 100 day MA, which could be just what this stock needs to push the price through this wedge pattern. The last time this pattern was set up in mid 2010, the price jumped 15.68% from 25.50 to 29.50 in just a few months. The stock continued to climb to 38.00 in the coming years.
