Long CR at 177.84 - sometimes you just gotta break the rulesI am on record more than once here saying that I don’t like trading stocks without long trading histories. I stand by that “rule” but on this occasion, I’m going to break it. That lovely uptrend is only part of the reason why.
NYSE:CR has only been publicly traded since the spring of 2023. I
Next report date
—
Report period
—
EPS estimate
—
Revenue estimate
—
5 EUR
284.67 M EUR
2.06 B EUR
56.93 M
About Crane Company
Sector
Industry
CEO
Max Homer Mitchell
Website
Headquarters
Stamford
Founded
1855
FIGI
BBG01G6YB5K6
Crane Co. designs and manufactures aerospace, electronics & engineered industrial products. It operates through four segments: Aerospace & Electronics, Process Flow Technologies, Payment & Merchandising Technology, and Engineered Materials. The company was founded by Richard Teller Crane on July 4, 1855 and is headquartered in Stamford, CT.
Related stocks

Breakout or Breakdown?Waiting to see which way this one goes. Need a close outside the green line either upward or down. Looking for a 13-14 point move. Just have to wait for the set-up.

Crane Company CR 1D short thesisCR has seen positive momentum the past 3 days only to see resistance at 150. This coincides with the stocks all time high. July 12th also printed a gravestone doji candle, indicating a bearish reversal and a downward trend in price.

Buy Crane CompanyShort Term Trading Advice by Naranj Capital
Buy Crane Company
● Buy Range- 134 - 136.5
● Target- 144 - 145
● StopLoss- 129.5
● Potential Return- 5-6%
● Duration- 10-12 Trading Days

Crane Holdings (CR) Surges Over 5.1%Crane Holdings (CR) shares rallied 5.1% in the last trading session to close at $117.07. This move can be attributable to notable volume with a higher number of shares being traded than in a typical session. This compares to the stock's 7.7% loss over the past four weeks.
The stock gained primarily
Crane Co (CR) Reports Strong Q3 2023 ResultsCrane Co (CR) Reports Strong Q3 2023 Results and Raises Full Year EPS Guidance.
On October 23, 2023, Crane Co (NYSE:CR) released its financial results for the third quarter of 2023, reporting strong performance and raising its full-year outlook. The company's earnings from continuing operations per


ABC bullish Gaps OverheadA struggle to say the least. This one may hit C again Fundamentals are good. Market timing not quite there yet
Crane Co. manufactures and sells engineered industrial products in the United States, Canada, the United Kingdom, Continental Europe, and internationally. The company's Fluid Handling se

$CR potential breakout from simetrical triangle on weekly chart$CR price has been forming a simetrical triangle for the past year
Price action suggests that we might go and breakout from it (keep in mind it tried in july and failed)
MACD and RSI support the move up
Look for a WEEKLY close outside the triangle in order to participate
Measured target around 114.9

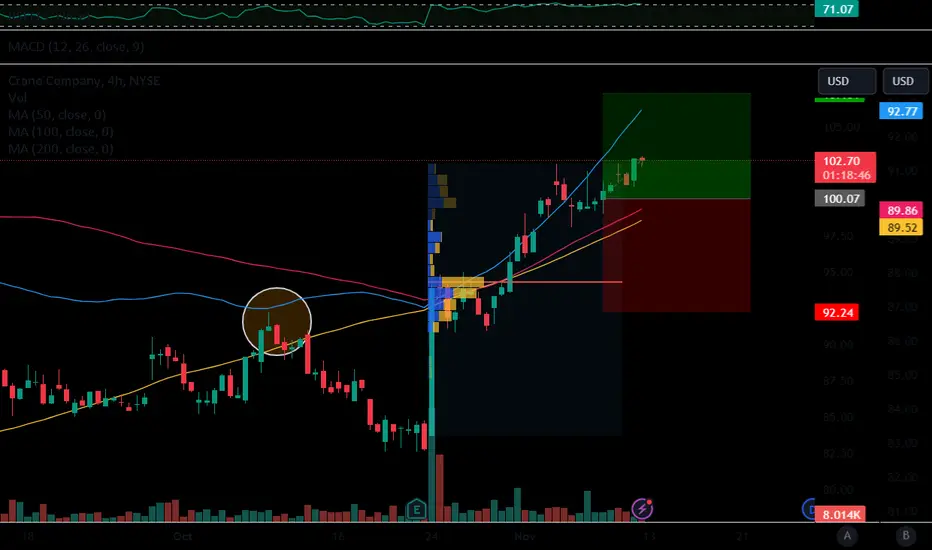
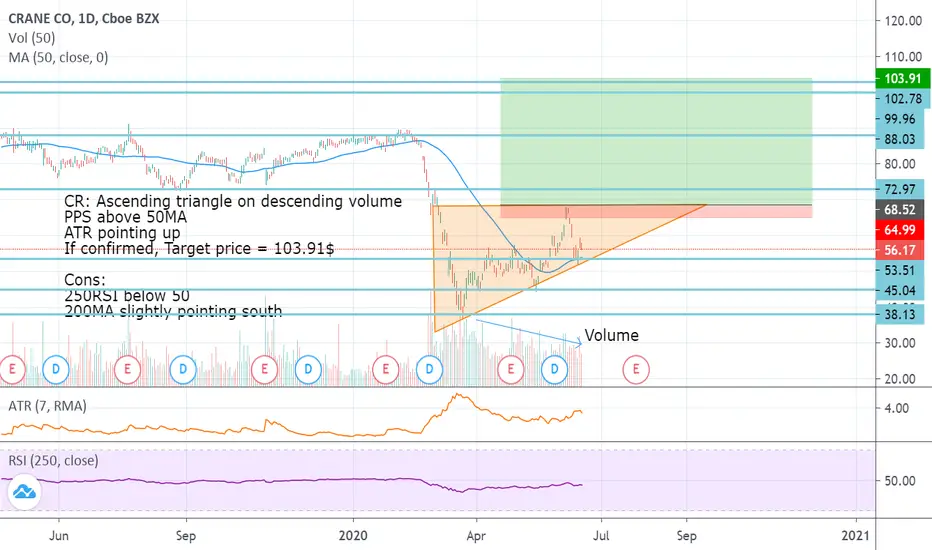
CR: Ascending triangleCR: Ascending triangle on descending volume
PPS above 50MA
ATR pointing up
If confirmed, Target price = 103.91$
Cons:
250RSI below 50
200MA slightly pointing south
See all ideas
Summarizing what the indicators are suggesting.
Neutral
SellBuy
Strong sellStrong buy
Strong sellSellNeutralBuyStrong buy
Neutral
SellBuy
Strong sellStrong buy
Strong sellSellNeutralBuyStrong buy
Neutral
SellBuy
Strong sellStrong buy
Strong sellSellNeutralBuyStrong buy
An aggregate view of professional's ratings.
Neutral
SellBuy
Strong sellStrong buy
Strong sellSellNeutralBuyStrong buy
Neutral
SellBuy
Strong sellStrong buy
Strong sellSellNeutralBuyStrong buy
Neutral
SellBuy
Strong sellStrong buy
Strong sellSellNeutralBuyStrong buy
Displays a symbol's price movements over previous years to identify recurring trends.
Frequently Asked Questions
The current price of T12 is 168 EUR — it has decreased by −0.58% in the past 24 hours. Watch CRANE CO. stock price performance more closely on the chart.
Depending on the exchange, the stock ticker may vary. For instance, on FWB exchange CRANE CO. stocks are traded under the ticker T12.
T12 stock has risen by 7.59% compared to the previous week, the month change is a 6.25% rise, over the last year CRANE CO. has showed a 20.86% increase.
We've gathered analysts' opinions on CRANE CO. future price: according to them, T12 price has a max estimate of 199.16 EUR and a min estimate of 173.19 EUR. Watch T12 chart and read a more detailed CRANE CO. stock forecast: see what analysts think of CRANE CO. and suggest that you do with its stocks.
T12 stock is 1.19% volatile and has beta coefficient of 1.34. Track CRANE CO. stock price on the chart and check out the list of the most volatile stocks — is CRANE CO. there?
Today CRANE CO. has the market capitalization of 9.88 B, it has increased by 7.23% over the last week.
Yes, you can track CRANE CO. financials in yearly and quarterly reports right on TradingView.
CRANE CO. is going to release the next earnings report on Oct 27, 2025. Keep track of upcoming events with our Earnings Calendar.
T12 earnings for the last quarter are 1.26 EUR per share, whereas the estimation was 1.13 EUR resulting in a 11.71% surprise. The estimated earnings for the next quarter are 1.30 EUR per share. See more details about CRANE CO. earnings.
CRANE CO. revenue for the last quarter amounts to 489.99 M EUR, despite the estimated figure of 480.49 M EUR. In the next quarter, revenue is expected to reach 506.78 M EUR.
T12 net income for the last quarter is 73.35 M EUR, while the quarter before that showed 66.00 M EUR of net income which accounts for 11.13% change. Track more CRANE CO. financial stats to get the full picture.
Yes, T12 dividends are paid quarterly. The last dividend per share was 0.20 EUR. As of today, Dividend Yield (TTM)% is 0.44%. Tracking CRANE CO. dividends might help you take more informed decisions.
CRANE CO. dividend yield was 0.54% in 2024, and payout ratio reached 16.22%. The year before the numbers were 0.46% and 12.13% correspondingly. See high-dividend stocks and find more opportunities for your portfolio.
As of Jul 31, 2025, the company has 7.3 K employees. See our rating of the largest employees — is CRANE CO. on this list?
EBITDA measures a company's operating performance, its growth signifies an improvement in the efficiency of a company. CRANE CO. EBITDA is 380.65 M EUR, and current EBITDA margin is 19.09%. See more stats in CRANE CO. financial statements.
Like other stocks, T12 shares are traded on stock exchanges, e.g. Nasdaq, Nyse, Euronext, and the easiest way to buy them is through an online stock broker. To do this, you need to open an account and follow a broker's procedures, then start trading. You can trade CRANE CO. stock right from TradingView charts — choose your broker and connect to your account.
Investing in stocks requires a comprehensive research: you should carefully study all the available data, e.g. company's financials, related news, and its technical analysis. So CRANE CO. technincal analysis shows the buy rating today, and its 1 week rating is strong buy. Since market conditions are prone to changes, it's worth looking a bit further into the future — according to the 1 month rating CRANE CO. stock shows the strong buy signal. See more of CRANE CO. technicals for a more comprehensive analysis.
If you're still not sure, try looking for inspiration in our curated watchlists.
If you're still not sure, try looking for inspiration in our curated watchlists.