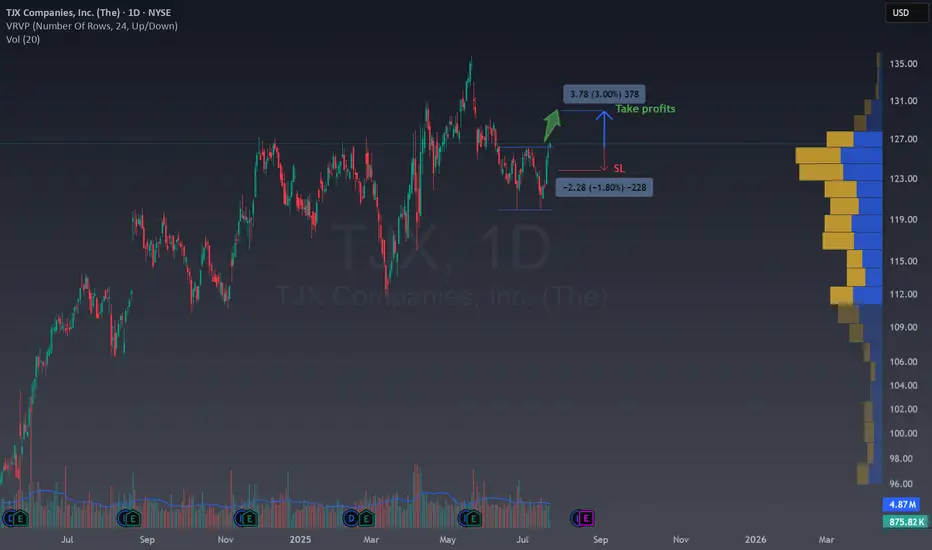
Easy double bottom in TJXTechnical Overview
NYSE:TJX is currently trading around $126.72 and is forming a double bottom.
Breaking the 126$ activates the double bottom in the middle of a bull trend , which is a bull pattern inside another bull pattern, could you imagine a better moment to buy?
Fundamental Arguments
Next report date
—
Report period
—
EPS estimate
—
Revenue estimate
—
3.80 EUR
4.70 B EUR
54.41 B EUR
1.11 B
About TJX Companies, Inc. (The)
Sector
Industry
CEO
Ernie L. Herrman
Website
Headquarters
Framingham
Founded
1962
FIGI
BBG000C9YP21
The TJX Cos., Inc. engages in the retail of apparel and home fashion products. It operates through the following business segments: Marmaxx, HomeGoods, TJX Canada, and TJX International. The Marmaxx segment sells family apparel including apparel, home fashions, and other merchandise. The HomeGoods segment offers an assortment of home fashions, including furniture, rugs, lighting, soft home, decorative accessories, tabletop and cookware as well as expanded pet, kids, and gourmet food departments. The TJX Canada segment operates the Winners, Marshalls, and HomeSense chains in Canada. The TJX International segment includes operations of T.K. Maxx and Homesense chains in Europe and the T.K. Maxx chain in Australia. The company was founded by Bernard Cammarata in 1962 and is headquartered in Framingham, MA.
Related stocks
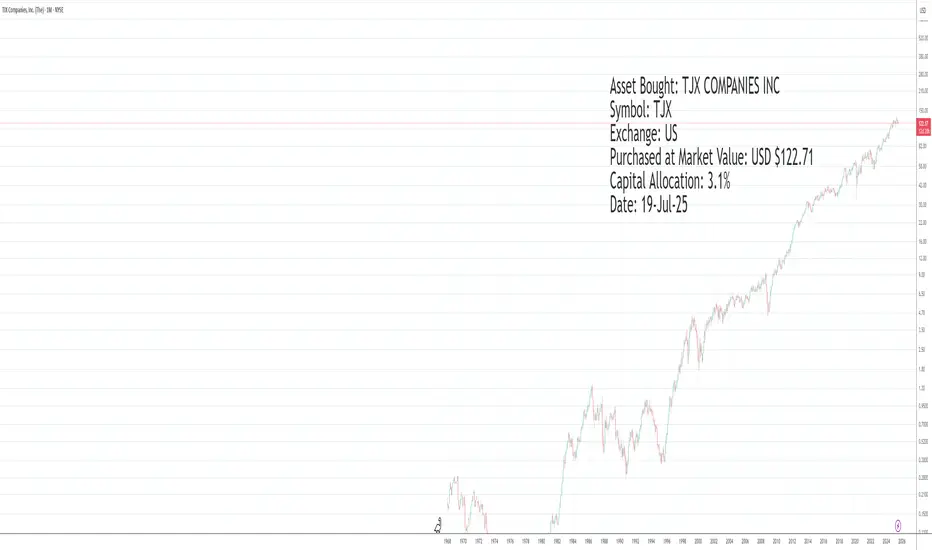
Asset Bought: TJX COMPANIES INCAsset Bought: TJX COMPANIES INC
Symbol: TJX
Exchange: US
Purchased at Market Value: USD $122.71
Capital Allocation: 3.1%
Date: 19-Jul-25
TJX Buy/LongTechnical analysis of the company. According to financial indicators, the company is currently undervalued and is supported by SMA200. The target price for the company is $145.

TJX: Sudden Drop After EarningsTJX fell sharply after its latest earnings report, and some traders may see more downside risk.
The first pattern on today’s chart is the drop on May 21 after backward-looking results beat estimates, but forward-looking guidance disappointed. Also notice the action on February 26, when an initi

$TJX with a bullish outlook following its earnings #StocksThe PEAD projected a bullish outlook for NYSE:TJX after a negative under reaction following its earnings release placing the stock in drift D with an expected accuracy of 50%.

TJX (TJX) Off-Price Model Draws Consistent Consumer DemandTJX Companies, Inc. (TJX) is a major off-price retailer known for brands like T.J. Maxx, Marshalls, and HomeGoods. The company offers name-brand apparel and home goods at discounted prices, attracting value-conscious shoppers in any economy. With a wide footprint and strong inventory management, TJX

Relative Strength in Individual NamesTJX has been basing for 5+ Months near it's ATH.
Despite the market conditions the past 2 months this held up really well.
We broke up out of the base just to pullback below it. I think a lot of traders are frustrated after the FBO and now we can curl up back above it and really get going.
This

TJX Short I see several divergences forming for NYSE:TJX I say NYSE:TJX will move downward and test 122

Downgoing TJX. TJXEarly in the correction to a fairly large bullish impulse. Technically, we are all bearish across the board, plus divergences on some indicators on the latest set of peaks.

$TJX with a bullish outlook following its earnings #StocksThe PEAD projected a bullish outlook for NYSE:TJX after a negative over reaction following its earnings release placing the stock in drift C with an expected accuracy of 50%.

See all ideas
Summarizing what the indicators are suggesting.
Neutral
SellBuy
Strong sellStrong buy
Strong sellSellNeutralBuyStrong buy
Neutral
SellBuy
Strong sellStrong buy
Strong sellSellNeutralBuyStrong buy
Neutral
SellBuy
Strong sellStrong buy
Strong sellSellNeutralBuyStrong buy
An aggregate view of professional's ratings.
Neutral
SellBuy
Strong sellStrong buy
Strong sellSellNeutralBuyStrong buy
Neutral
SellBuy
Strong sellStrong buy
Strong sellSellNeutralBuyStrong buy
Neutral
SellBuy
Strong sellStrong buy
Strong sellSellNeutralBuyStrong buy
Displays a symbol's price movements over previous years to identify recurring trends.
TJX4972595
TJX Companies, Inc. 4.5% 15-APR-2050Yield to maturity
5.96%
Maturity date
Apr 15, 2050
TJX5082157
TJX Companies, Inc. 1.6% 15-MAY-2031Yield to maturity
4.67%
Maturity date
May 15, 2031
TJX4401499
TJX Companies, Inc. 2.25% 15-SEP-2026Yield to maturity
4.37%
Maturity date
Sep 15, 2026
TJX4972594
TJX Companies, Inc. 3.875% 15-APR-2030Yield to maturity
4.36%
Maturity date
Apr 15, 2030
TJX5082156
TJX Companies, Inc. 1.15% 15-MAY-2028Yield to maturity
4.27%
Maturity date
May 15, 2028
See all TJX bonds
Frequently Asked Questions
The current price of TJX is 108.14 EUR — it has increased by 0.82% in the past 24 hours. Watch TJX COS INC. DL 1 stock price performance more closely on the chart.
Depending on the exchange, the stock ticker may vary. For instance, on FWB exchange TJX COS INC. DL 1 stocks are traded under the ticker TJX.
TJX stock has risen by 3.15% compared to the previous week, the month change is a 1.22% rise, over the last year TJX COS INC. DL 1 has showed a 5.75% increase.
We've gathered analysts' opinions on TJX COS INC. DL 1 future price: according to them, TJX price has a max estimate of 141.13 EUR and a min estimate of 103.26 EUR. Watch TJX chart and read a more detailed TJX COS INC. DL 1 stock forecast: see what analysts think of TJX COS INC. DL 1 and suggest that you do with its stocks.
TJX stock is 0.84% volatile and has beta coefficient of 0.42. Track TJX COS INC. DL 1 stock price on the chart and check out the list of the most volatile stocks — is TJX COS INC. DL 1 there?
Today TJX COS INC. DL 1 has the market capitalization of 120.08 B, it has decreased by −1.69% over the last week.
Yes, you can track TJX COS INC. DL 1 financials in yearly and quarterly reports right on TradingView.
TJX COS INC. DL 1 is going to release the next earnings report on Aug 20, 2025. Keep track of upcoming events with our Earnings Calendar.
TJX earnings for the last quarter are 0.81 EUR per share, whereas the estimation was 0.81 EUR resulting in a 0.56% surprise. The estimated earnings for the next quarter are 0.86 EUR per share. See more details about TJX COS INC. DL 1 earnings.
TJX COS INC. DL 1 revenue for the last quarter amounts to 11.58 B EUR, despite the estimated figure of 11.49 B EUR. In the next quarter, revenue is expected to reach 12.01 B EUR.
TJX net income for the last quarter is 914.78 M EUR, while the quarter before that showed 1.35 B EUR of net income which accounts for −32.22% change. Track more TJX COS INC. DL 1 financial stats to get the full picture.
Yes, TJX dividends are paid quarterly. The last dividend per share was 0.38 EUR. As of today, Dividend Yield (TTM)% is 1.23%. Tracking TJX COS INC. DL 1 dividends might help you take more informed decisions.
TJX COS INC. DL 1 dividend yield was 1.21% in 2024, and payout ratio reached 35.22%. The year before the numbers were 1.36% and 34.45% correspondingly. See high-dividend stocks and find more opportunities for your portfolio.
As of Jul 27, 2025, the company has 364 K employees. See our rating of the largest employees — is TJX COS INC. DL 1 on this list?
EBITDA measures a company's operating performance, its growth signifies an improvement in the efficiency of a company. TJX COS INC. DL 1 EBITDA is 6.59 B EUR, and current EBITDA margin is 13.04%. See more stats in TJX COS INC. DL 1 financial statements.
Like other stocks, TJX shares are traded on stock exchanges, e.g. Nasdaq, Nyse, Euronext, and the easiest way to buy them is through an online stock broker. To do this, you need to open an account and follow a broker's procedures, then start trading. You can trade TJX COS INC. DL 1 stock right from TradingView charts — choose your broker and connect to your account.
Investing in stocks requires a comprehensive research: you should carefully study all the available data, e.g. company's financials, related news, and its technical analysis. So TJX COS INC. DL 1 technincal analysis shows the buy rating today, and its 1 week rating is sell. Since market conditions are prone to changes, it's worth looking a bit further into the future — according to the 1 month rating TJX COS INC. DL 1 stock shows the buy signal. See more of TJX COS INC. DL 1 technicals for a more comprehensive analysis.
If you're still not sure, try looking for inspiration in our curated watchlists.
If you're still not sure, try looking for inspiration in our curated watchlists.