$TMO with a Neutral outlook following its earnings #Stocks The PEAD projected a Neutral outlook for $TMO after a Negative Under reaction following its earnings release placing the stock in drift D
If you would like to see the Drift for another stock please message us. Also click on the Like Button if this was useful and follow us or join us.
TN8 trade ideas


TMO 🌦TMO Looks ready to take off. I think now would be the time to start looking into leaps. Just waiting for 5 min chart signal.

$TMO with a bullish outlook following its earnings #Stocks The PEAD projected a bullish outlook for $TMO after a positive under reaction following its earnings release placing the stock in drift A
If you would like to see the Drift for another stock please message us. Also click on the Like Button if this was useful and follow us or join us.

Thermo Fisher - always liked this companyBought a small 11 share position, because I haven't owned it in many years. Stumbled across the idea from an ARK trading report (or Tweet). Not the best trading discipline, but I plan to hold these for a while, and perhaps build a position.
Didn't consider the options.

Great Fundamentals, and great long entry in Thermo FisherGreat value here in a hot market:
P/E 30
Forward P/Q 24.4
P/FCF 49.4
Debt/Eq 0.66
Quick Ratio 2.9
Company Information
Market Cap 194B
Income 6.3B
Dividend 0.18%
Employees 75,000
Earnings
EPS this Y 22%
EPS Past 5Y 14%
Sales Q/Q +35.9%
Equity
Insiders Own 0.1%
Insider Transactions -21.9% (Last 3 months)
Institutions Own 91.6%
Institutions added 0.21% (last 3 months)
Section 4 Forms:
Insider transactions were consolidated largely from Mark Stevenson the COO & Mark Casper the Chairman CEO exercising options and selling equity. Dec 4th & December 7th.
Wish they paid out a better dividend than 0.18% but I must admit I am impressed seeing a net margin of 11% which is why I am slapping them with a $525 price target.


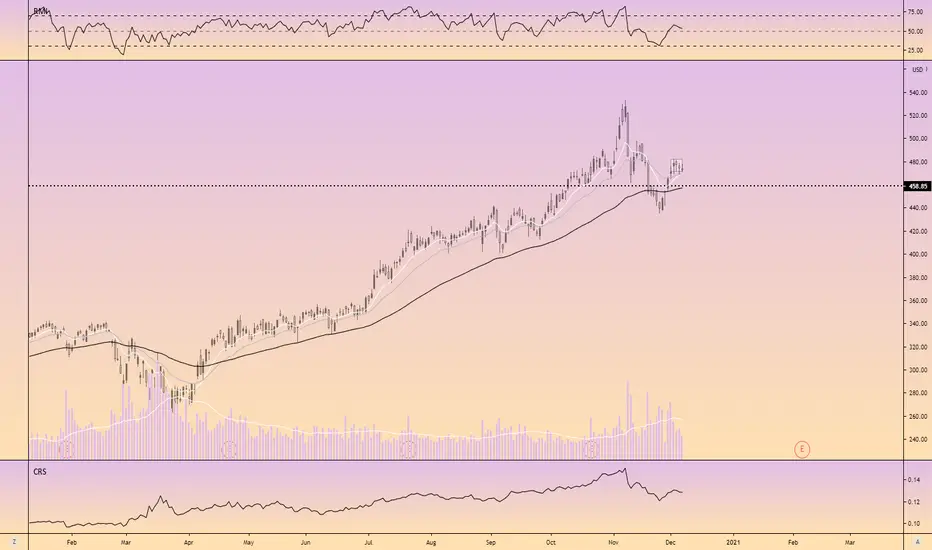
Ready for big moveI never traded this before but NYSE:TMO is picked by my algo scanner. It's a buy around 438 area more likely consolidate there then start moving up. The first target could be 493 and the second could be 525 with the stop loss around 412. Good PL ratio, IMO.

TMO - EW analysis - C of flat correction downTMO - It already completed impulse before started this correction cycle. The up move was abc zigzag as the part of flat correction. The C down cycle is in progress. Sell on bounce of 2nd wave correction and expected to go down up to 430.
Give thumbs up if you really like the trade idea/analysis.

$TMO 2+ Month Cup and Handle SetupThermo Fisher forming a cup and handle breakout setup. The stock had a nice early long entry that I have marked on the chart. Tight price action and low volume are the optimal characteristics I look for around my entry points and the early entry setup exhibited just that allowing for a low risk long entry. I will be looking for similar characteristics while the handle is forming.
Thermo Fisher Scientific (TMO)- MANUFACTURES MASS SPECTROMETRY, LIQUID AND GAS CHROMATOGRAPHY, AND OPTICAL SPECTROSCOPY INSTRUMENTS

TMO long 50 MA bounce + MCD + volumeentry: 475
stop: 2.86% below
target: 5.91%
reasons: 1. 50MA support. 2. MCD cross. 3. high volume & tight price action 4. TMO is a leader in it's area.
don't forget to like and follow!

THERMO FISHER DAILY ANALYSISHi friends
the graph shows that this market will experience an uptrend with a high probability


Bull Call Spread Entry StrategyThis strategy uses the Spread Entry Overlay indicator I designed to show entry points designed to be optimized for an Option Bull
Call Spread.
All of the user settings from the overlay are pulled into this for customization purposes. I will not go into detail of the indicator itself, but have shared the link in the "Related Ideas," in case the overall setup of the indicator is needed.
As for this strategy...
The defaults for the strategy itself are as follows:
Period for strategy: 1/1/18 to 12/1/2021. This can be changed to a different period using the settings.
Condition for entry:
Bull Spread Entry Strength >= "Overlay Signal Strength Level"
Limit entry is used, price must be <= close when signaled
Entry occurs by next day or the order is cancelled
Condition for exit (timed):
Bars passed since order entry >= 30 (6 weeks..~42 calendar days)
Thursday (day before "option" expiration date... assuming weekly options exist)
The link


7 day scare windowThe vaccine stocks didn't explode this week as some of us holding the stocks were hoping for. Either the news was priced in for some stocks, or (as I believe is the case for TMO), it needs another catalyst to really jump back into its bullish channel (green channel -- which has a possible target of 530 - 560!)
I have updated the cycles for TMO and think it sits a bit better in the updated cycle analysis. TMO is in a tight wedge at the moment, but today or tomorrow should give some indication which side it will break towards.
7 Days Risky Window
I hate to say it, but I am seeing this window with a number of stocks since over a month. Seeing now that indexes are over-extended and are just hanging on the stimulus news, I see a potential for a dip over the coming 7 days. The red arrows track this risk. This is only for the near term, as I see TMO bouncing off the 100MA and moving back up as vaccine news and earnings reports near towards January.
Good luck!