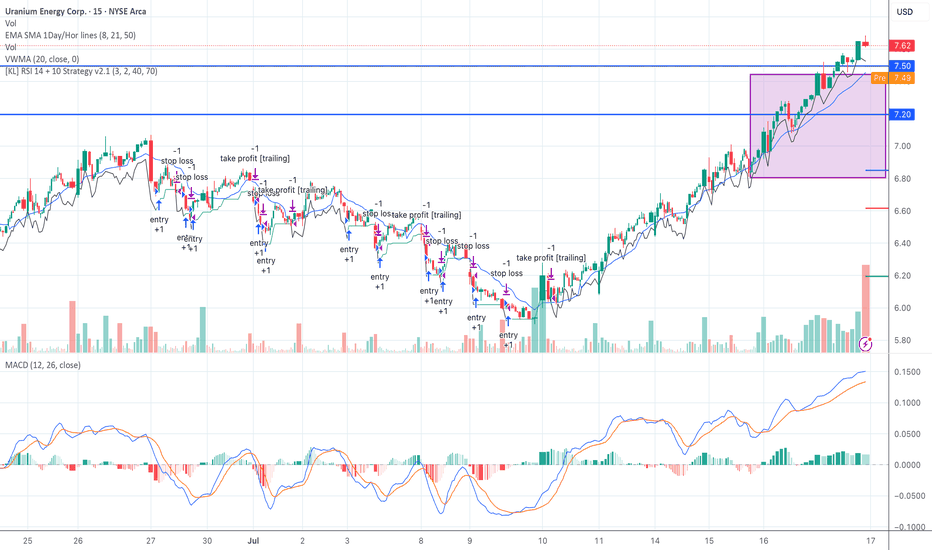
UEC Box Breakout Confirmed – Riding VWMA on VolumeUEC broke out of the $6.80–$7.45 box with volume and is holding strong. VWMA rising, MACD trending, and RSI strategy taking partials.
Watching $8.00 for target, $7.20 as trailing stop zone.
Classic Seed System box breakout — low risk, clean structure.
#UEC #SeedSystem #BreakoutTrade #VolumeConfirmation #UraniumStocks
U6Z trade ideas
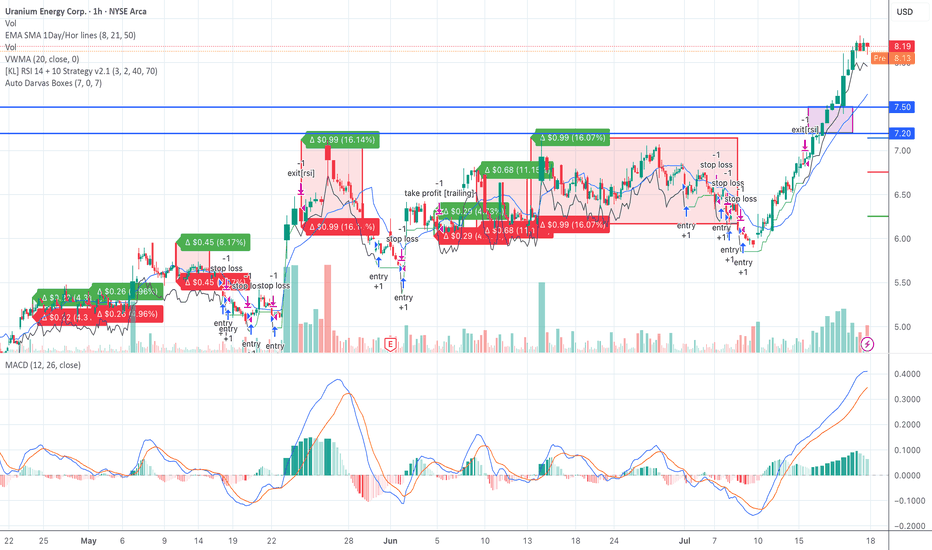
UEC Breakout Confirmed — Seed System Entry Active Above $7.50UEC confirmed a breakout above the $7.20–$7.50 Darvas Box we've been tracking.
Entry triggered at $7.51 on rising volume. Price is holding above VWMA ($7.64) and the EMA stack (8, 21, 50). MACD is showing strong momentum, and RSI remains in a healthy range.
Target 1: $8.50
Target 2: $9.00
Stop loss: $7.20
This is a textbook Seed System setup — breakout from a clean range with all signals aligned.
Let me know if you're in this trade or watching other uranium plays.
#UEC #SeedSystem #BreakoutTrade #DarvasBox #VWMA #MACD #UraniumStocks #SwingTrading
Long Uranium and Nuclear via UECMy price targets for UEC. Based on the US Government's newly restored enthusiasm for Nuclear power & their borderline hostility towards dependance on other nations for much of anything, I think this All-American uranium company is ripe for a big run. I believe it will go way past my price targets and I may only trim half of my position if TP 3 hits.
UEC: Close to a Substantial Bottom? Bullish Outlook!The current pullback, which began in December, is still unfolding. Right now, the market is testing the white wave 2 support zone between $4.80 and $5.46, but the chart doesn’t yet look ready for an upside reversal. Even in the white scenario, a bit more downside is likely with some small downward moves still to come.
In the orange scenario, the price would likely form a larger 4-5 structure to the downside. If UEC breaks below the wave 2 low at $4.10 (a swing low from September 2024), the orange wave 2 scenario would take precedence, with support between $3.86 and $3.08.
Despite the short-term weakness, the overall structure remains bullish. Whether this is a smaller-degree wave 2 or a larger-degree wave 2 is still unclear, but the long-term outlook for UEC remains positive. I'm closely watching for an upside reversal, with the first signal coming from a break above $6.34.
Uranium Energy is it right time to buy?Price Levels and Trends
1. Resistance Levels:
$7.70: The price has faced resistance at this level recently.
$7.68: Another resistance point that the price recently touched but failed to break.
2. Support Levels:
$5.83: The current support level, which has held the price from falling further.
$4.35: The next support level, indicating potential support if the price drops below $5.83.
$2.40: A historical support level from previous years.
$0.5792: A very low historical support level, indicating the minimum price over the chart's timeframe.
Trend Analysis
Uptrend Channel : The price is moving within an ascending channel, with higher highs and higher lows. The upper trendline acts as resistance while the lower trendline acts as support.
Current Position : The price recently hit the upper resistance of the channel around $7.68-$7.70 and has retraced to the support level around $5.83.
Indicators
1. Stochastic RSI:
Current Value: The Stochastic RSI is around 62.61, indicating a neutral to slightly overbought condition. This suggests there might be some room for the price to move up before becoming overbought, but caution is warranted.
2. Cumulative Volume Delta (CVD):
Current Value: The CVD is showing a significant negative value (-35.662M), indicating that selling pressure has been dominant. This could mean that despite price increases, sellers have been in control, potentially foreshadowing further price declines or consolidation.
Trade Idea | UEC | Uranium Energy Corp | Long Long Entry: $7.50
Stop: $6:00
We will be taking this trade right after a minor pullback from this current level of $8.56.
I think there will be more potential upside on this stock as every countries are increasing the power demand due to AI development.
We are now seeing nuclear power revival as uranium energy can produce more energy compared to coal.
Uranium Energy Corporation (UEC) AnalysisCompany Overview: Uranium Energy Corporation AMEX:UEC is strategically positioned for growth with the restart of its in-situ recovery (ISR) uranium production at the Christensen Ranch project. This project commenced sending resin to the Irigaray Central Processing Plant in August 2024, marking a significant step in UEC’s operational ramp-up.
Key Catalysts:
Global Nuclear Energy Demand: The increasing demand for nuclear energy, propelled by partnerships with major technology firms like Google and Amazon, bolsters UEC’s market position. These collaborations highlight the role of nuclear energy in achieving sustainability and energy security amid growing global energy needs.
Strategic Focus on North America: UEC's emphasis on North American uranium production aligns with recent U.S. and EU bans on Russian uranium, ensuring a reliable domestic supply. This local production capability enhances UEC's competitive advantage in the face of geopolitical challenges affecting the uranium market.
Unhedged Strategy: UEC’s unhedged approach allows investors to benefit directly from rising uranium prices, which are currently hovering around $80/lb. This strategy positions UEC favorably to capitalize on the anticipated increase in uranium demand and prices in the coming years.
Investment Outlook: Bullish Outlook: We are bullish on UEC above the $6.50-$7.00 range, as the resumption of production and the company’s strategic initiatives pave the way for significant growth opportunities. Upside Potential: Our target for UEC is set at $14.00-$15.00, driven by strong market fundamentals, the growing demand for nuclear energy, and UEC's proactive approach to domestic production.
🚀 UEC—Capitalizing on the Future of Clean Energy. #NuclearEnergy #UraniumMarket #CleanEnergyGrowth
UEC heads up at $6.66 (!) then $7.25: Uranium ready for a dip?Uranium has been on the uptick for a while.
Many are overbought and due for a pullback.
This is one example reaching key resistances.
$ 6.61 - 6.67 is the immediate resistance
$ 7.25 - 7.59 will be the breakout barrier.
$ 5.46 - 5.58 will be last uptrend support.
=======================================
UEC - COMMODITIES ON THE RISE - NUCLEAR CHRISTMAS SURPRISELooking at the most recent correction for UEC, nice accumulation.
Oscillators looking good, bullish divergence on recent lows.
BROKEN OUT OF FALLING WEDGE PATTERN and RESPECTING THE FIBS.
Looking to add more 5.05 area if possible.
First area of resistance above is 6.00-6.20 range. Once that has flipped to support, we could see $10.00 by Christmas!
Commodities are heating up...
LFG
UEC an uranium miner rerverses and warms up LONGUEC in the past several days has put in a double and bottom appears to be gaining bullish
momentum based on the trend angle from today. The volatility indicator triggered buying
price pressure five days ago as shown on the indicator and encirled. the volatility of yesterday
and today may be shorts covering to close synergized with new buyers. The uranium sector
is heating up at this time. Many of the stocks in this sector are over the counter. The ETFs
are URA and URNM. I will add to my long position in UEC now.
UEC an energy penny stock pops out of ascending channel LONGUEC is a uranium company somewhat independent of the oil, solar and lithium stocks that
dominate the energy sector. Nuclear is touted as green and not contributory to climate change
with no carbon impact. It pollution or radioactivity is self-contained and isolated with heavy
regulatory safeguards All that said, a few days ago analysts at Eight Capital raised the status
of UEC to "strong buy" with a price target of $13 or about 75% above current valuation. Such
a high upside is uncommon in the energy sector.
The 4H chart shows price broke out from an ascending channel of several months
duration with a corresponding relative volume of 4x the running mean. The price action
is that of a high tight flag patter n invoking the moderately strong probability of more
bullish momentum after a consolidation is completed.
I see this as a great long swing trade with earnings coming in two months or call options
OTM targeting a strike price of $10 for the mid-March expiration. Given the stock price at
present such call options would have about $40 premium per contract.
Lastly, the ETFs URA and URNM appear to track the price action of UEC fairly well. If a trader
prefers diversification or risk moderation of ETFs these two are reasonable alternatives.
Uranium trades do not have geopolitical risk to consider as much as oil and gas yet another
reason to give this a further look.
.
Bears are Hungry for UECTrying out the trading volume on large gainers. My hypothesis is that since they had such high trading volume the previous day,It's either due for a retracemnt or extension and I'll determine that by what the technical story tells me.
Fundamentals: This had a trading volume on Friday of 29.117M and on average has 7.296M
Technicals: Gap In price movement, so it should fill in, Bearish rising wedge
Indicator: we have MAJOR bearish divergence on the RSI, and with tells me that the pendant isn't a bullish pendant but a bearish rising wedge.
Uranium Energy Corp (NASDAQ: UEC) In-depth Analysis
The previous day’s close for UEC stock was $6.07, and it opened slightly lower at $6.06. Throughout the day, the stock experienced a range between $5.93 and $6.09. The trading volume for the day was 7,439 shares. The market capitalization for UEC is currently valued at $2.2 billion.
When examining the company’s earnings growth, it is evident that UEC has faced challenges in recent years. The earnings growth for the last year was reported at -146.91%, while the earnings growth for this year stands at -266.67%.
In contrast to the negative earnings growth, UEC experienced a significant revenue growth of 609.77% in the last year.
In terms of the company’s financial performance in the previous year, UEC reported an annual revenue of $164.4 million, but unfortunately, it incurred a net loss of -$3.3 million. The net profit margin for UEC is -2.01%.
Price Momentum
UEC is trading near the top of its 52-week range and above its 200-day simple moving average.
What does this mean?
Investors have been pushing the share price higher, and the stock still appears to have upward momentum. This is a positive sign for the stock's future value.
Uranium long trade on UECHello,
I was deciding between UEC and CCJ, and picked UEC, it had a higher ADR and I got lucky it came back for me to get in. I have been reading China is looking to heavily invest in nuclear energy, the sector gained some volume so I watched it and got in. Now I am just wondering where I am going to get out.
UEC/UXHi, this is an update, and a reminder to just look at this chart. Uranium energy concatenated with the underlying future. 1.20 target. UX will be over $100 in a jiffy. People are kidding themselves, and underestimating how big this U era, epoch is going to be, but I know. Strap in or strap on, whichever you prefer.
UEC/CCJHi, update on this pair, which I’ve covered before. I claimed prior that the pair target was 1, but the more I study it, the target is 1.5. This is critical data, and it can become intelligence if you know what to do with it. Otherwise, it just stays data. Just as BTC next swing high target is $130,000 implied by btc miners such as Riot, so to is UEC $675 implied by the cameco pair and “uec to spot” pair - as I’ve shown in previous charts. Basically, if you like Uranium, buy UEC and sit tight
UECUranium Energy fib channel and target zones. UEC/CCJ points to 1.5. My target for cameco is $450, so 1.5x cameco is $675 UEC theoretical. That roughly aligns with the top of the fib channel. Typically, I sell above the .618 for stocks, and above the .786 for cryptos. Long runway ahead guys for Uranium.


