Waste Management confluencesFirst of all fundamentally the company is basically essential to our survival so I have no reason to believe they will go out of business any time soon. Earnings report soon should bring about some volatility. I was foolish enough to buy the top a couple months ago and deciding today I will add the
Next report date
—
Report period
—
EPS estimate
—
Revenue estimate
—
6.16 EUR
2.65 B EUR
21.31 B EUR
401.46 M
About Waste Management, Inc.
Sector
Industry
CEO
James C. Fish
Website
Headquarters
Houston
Founded
1987
FIGI
BBG000DPKYM8
Waste Management, Inc. is a holding company, which engages in the provision of waste management environmental services. It operates through the following segments: Collection and Disposal-East Tier (East Tier), Collection and Disposal-West Tier (West Tier), Recycling Processing and Sales, WM Renewable Energy, and VM Healthcare Solutions. The East Tier segment includes the Eastern United States, the Great Lakes Region, and Canada. The West Tier segment refers to the upper Midwest region and British Columbia, Canada. The Recycling Processing and Sales segment focuses on the processing and sales of materials collected from residential, commercial, and industrial customers. The WM Renewable Energy segment develops, operates, and promotes projects for landfill gas use. The VM Healthcare Solutions segment relates to its primarily business to business company providing services that protect people and brands, promote health and well-being and safeguard the environment. The company was founded on September 30, 1987 and is headquartered in Houston, TX.
Related stocks
Waste Management price predictionFundamentally WM stock is proven to be resistant to recession. I have a position on the stock as a hedge against uncertainty it makes up about 15% of my portfolio as of this writing. I am looking to buy more at lower prices since I bought at a premium a couple weeks ago. I will try and hold indefini

Waste Management (WM): Waste and Recycling Demand GrowsWaste Management, Inc. (WM) is North America's leading provider of comprehensive waste and environmental services. The company offers collection, recycling, and disposal solutions to residential, commercial, and industrial customers. With a growing focus on sustainability, WM is expanding its recycl

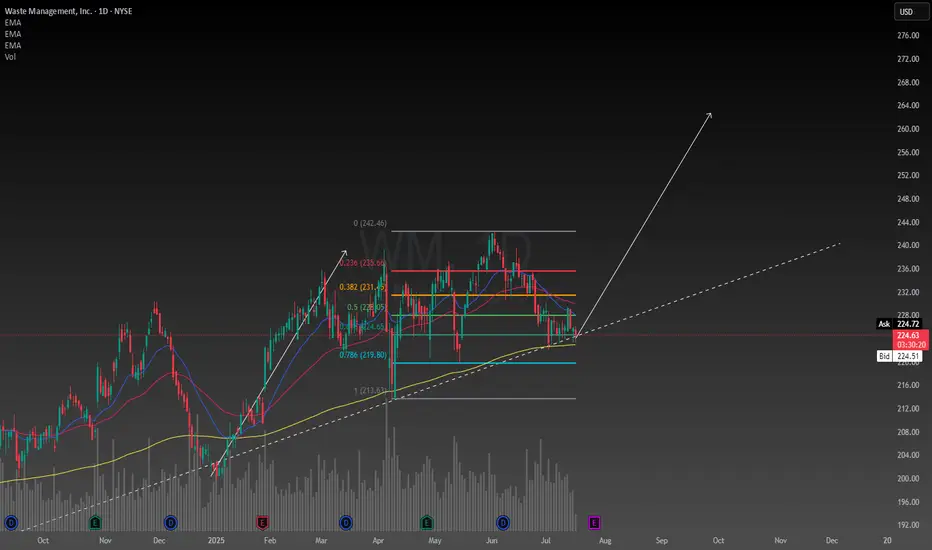
Waste Management long, there will always be trashNYSE:WM
ER out of the way, hugging the down trend line and tried to break out today
Leaps are the way to go....IMO

WM to $214My trading plan is very simple.
I buy or sell when price tags the top or bottom of parallel channels.
I confirm when price hits Fibonacci levels.
So...
Here's why I'm picking this symbol to do the thing.
Price at top of channels (period 100 52 & 26)
Stochastic Momentum Index (SMI) at overboug

Waste Management - Bullish Outlook - Rally- Base - RallyWaste Management is all about taking care of trash and making the environment a little bit cleaner. They're a big company with several different parts:
* They collect and dispose of waste on the East Coast and in Canada.
* They do the same thing on the West Coast and in parts of Canada.
* They sort

Consumer Goods Weak And Financials StrongThis is an extensive list but I went through over 500 charts yesterday. What I noticed was cloud solutions are strong while other tech is weak. Financials have been on fire both in the US and foreign banks. Consumer durable and non durable are very weak as is logistics, and manufacturing. Notice the


Waste Management WM is inside on the 3 month time frame
If we break $196.60we will go 2D on the Quarter
If we break $225.00 we will go 2U on the Quarter and break 52 Week high
On the daily we have a 2/2 Bearish Continuation
On the 4Hour we are Inside with a 1 Candle
Taking calls base off the 4 hour time frame

$WM NYSE:WM with the AMEX:SPY & NASDAQ:QQQ going to the dirty we do have some bullish outliers NYSE:WM have gap on the daily i would like to see some more up side push to the 61% fib then price rejeact and give a BOS to the -27%

See all ideas
Summarizing what the indicators are suggesting.
Neutral
SellBuy
Strong sellStrong buy
Strong sellSellNeutralBuyStrong buy
Neutral
SellBuy
Strong sellStrong buy
Strong sellSellNeutralBuyStrong buy
Neutral
SellBuy
Strong sellStrong buy
Strong sellSellNeutralBuyStrong buy
An aggregate view of professional's ratings.
Neutral
SellBuy
Strong sellStrong buy
Strong sellSellNeutralBuyStrong buy
Neutral
SellBuy
Strong sellStrong buy
Strong sellSellNeutralBuyStrong buy
Neutral
SellBuy
Strong sellStrong buy
Strong sellSellNeutralBuyStrong buy
Displays a symbol's price movements over previous years to identify recurring trends.
Curated watchlists where UWS is featured.


Frequently Asked Questions
The current price of UWS is 193.98 EUR — it has increased by 0.14% in the past 24 hours. Watch WASTE MANAGEMENT stock price performance more closely on the chart.
Depending on the exchange, the stock ticker may vary. For instance, on FWB exchange WASTE MANAGEMENT stocks are traded under the ticker UWS.
UWS stock has risen by 1.08% compared to the previous week, the month change is a −4.16% fall, over the last year WASTE MANAGEMENT has showed a −4.30% decrease.
We've gathered analysts' opinions on WASTE MANAGEMENT future price: according to them, UWS price has a max estimate of 237.50 EUR and a min estimate of 196.34 EUR. Watch UWS chart and read a more detailed WASTE MANAGEMENT stock forecast: see what analysts think of WASTE MANAGEMENT and suggest that you do with its stocks.
UWS stock is 0.14% volatile and has beta coefficient of 0.16. Track WASTE MANAGEMENT stock price on the chart and check out the list of the most volatile stocks — is WASTE MANAGEMENT there?
Today WASTE MANAGEMENT has the market capitalization of 78.12 B, it has increased by 0.68% over the last week.
Yes, you can track WASTE MANAGEMENT financials in yearly and quarterly reports right on TradingView.
WASTE MANAGEMENT is going to release the next earnings report on Jul 28, 2025. Keep track of upcoming events with our Earnings Calendar.
UWS earnings for the last quarter are 1.54 EUR per share, whereas the estimation was 1.47 EUR resulting in a 5.31% surprise. The estimated earnings for the next quarter are 1.61 EUR per share. See more details about WASTE MANAGEMENT earnings.
WASTE MANAGEMENT revenue for the last quarter amounts to 5.56 B EUR, despite the estimated figure of 5.65 B EUR. In the next quarter, revenue is expected to reach 5.40 B EUR.
UWS net income for the last quarter is 588.81 M EUR, while the quarter before that showed 577.65 M EUR of net income which accounts for 1.93% change. Track more WASTE MANAGEMENT financial stats to get the full picture.
Yes, UWS dividends are paid quarterly. The last dividend per share was 0.72 EUR. As of today, Dividend Yield (TTM)% is 1.39%. Tracking WASTE MANAGEMENT dividends might help you take more informed decisions.
WASTE MANAGEMENT dividend yield was 1.49% in 2024, and payout ratio reached 44.07%. The year before the numbers were 1.56% and 49.45% correspondingly. See high-dividend stocks and find more opportunities for your portfolio.
As of Jul 17, 2025, the company has 61.7 K employees. See our rating of the largest employees — is WASTE MANAGEMENT on this list?
EBITDA measures a company's operating performance, its growth signifies an improvement in the efficiency of a company. WASTE MANAGEMENT EBITDA is 6.20 B EUR, and current EBITDA margin is 29.68%. See more stats in WASTE MANAGEMENT financial statements.
Like other stocks, UWS shares are traded on stock exchanges, e.g. Nasdaq, Nyse, Euronext, and the easiest way to buy them is through an online stock broker. To do this, you need to open an account and follow a broker's procedures, then start trading. You can trade WASTE MANAGEMENT stock right from TradingView charts — choose your broker and connect to your account.
Investing in stocks requires a comprehensive research: you should carefully study all the available data, e.g. company's financials, related news, and its technical analysis. So WASTE MANAGEMENT technincal analysis shows the sell today, and its 1 week rating is neutral. Since market conditions are prone to changes, it's worth looking a bit further into the future — according to the 1 month rating WASTE MANAGEMENT stock shows the buy signal. See more of WASTE MANAGEMENT technicals for a more comprehensive analysis.
If you're still not sure, try looking for inspiration in our curated watchlists.
If you're still not sure, try looking for inspiration in our curated watchlists.