WMT Walmart Short bias the coming weekHi folks, noticed a bearish consolidation triangle in WMT possibly under formation. If i get bearish confirmation ill enter with initial target area just above current support 118.60. Let me know what you think.
WMT trade ideas

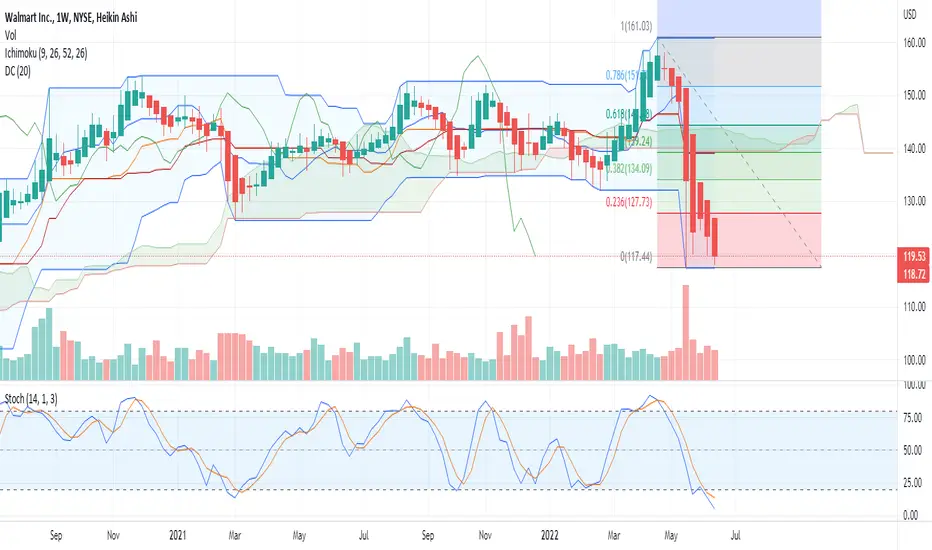
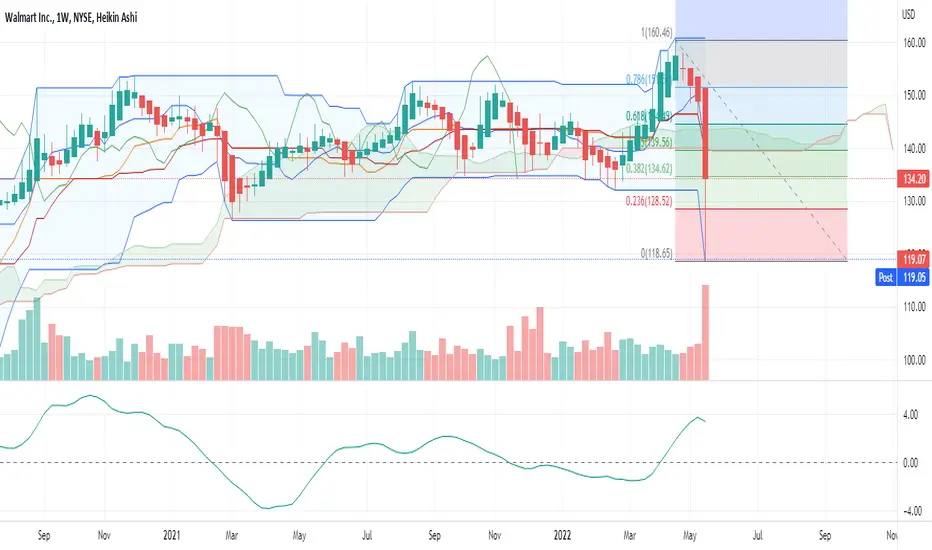
Walmart stock close to be in a big bearish movehello,
Walmart is in critical stage because we are close to break down an important level
what we should keep eye on is these level bellow, when they are broken with a nice volume the stock will have a free fall toward the other level shwon on myu chart.
Remeber that i am not using cristal ball predicting markets' future but i try to be more effecient end mor rationnal on may markets analysis.
Do not hestate asking me some markets' analysis' i will be glade to answer you
Good luck

WMT oversold again daily and weekly chartsPurchased 100 July 15th $120 calls looking for another bounce in WMT to $125+ in coming week(s)

WMT Double bottom. Short down trend brokenAfter falling from 160 USD a share, WMT formed double bottom at around 117 USD a share, and a high of 129 USD a share in between. The short time trend from 129 to 117 is now broken to the up side with decent volume.

Walmart Speculated Bear SqueezeWalmart is one of those stocks not very trusted to trade with, apparently Walmart was manipulated by a whale to prevent it from falling, causing maximum pain, of course i had a 97% loss from this manipulation, Target, Dollar General, Costco, Lowes, Home Depot and more consumer based stocks took the pain that was EXPECTED from the CPI report, but oh man didn't walmart pull a U-turn.
Of course being manipulated, the whale to whoever pulled this stunt, did a bearish sweep for 115 for walmart expiring 6/17.
Additional information to my research, walmart had a lower high when this started vs other consumer preceded lower on the RSI, signaling i shouldve pulled out. Damage is done, and can only learn from experience.
Walmart profit goal for next week hidden bearish divergence in the RSI;
1. 118
2.115
3. 108
4. 105
NOT FINANCIAL ADVICE, always do your own due diligence
Follow my Instagram @analyze.with.pepe to see more content coming soon!

What to expect from Walmart. I wouldn't buy if I know this.There are a lot of people saying about buying now, giving signals like if there is no tomorrow, like if buying stocks is free... I don't see the point in buying anything for the long term right now because of many different reasons:
1. April Consumer Credit +$38.07BN, Exp. $35.0BN . The revolving credit increase was $17.8BN. The second-highest on record.
When investors devote too much of their cash to equities in aggregate, the market underperforms over the next ten years. This predicts that stocks will produce lower-than-average returns over the following ten years. While you don't have to shun equities entirely, you should adjust your expectations properly. Alternatively, wait for the stock allocation to drop down considerably before buying, which can happen if the market truly capitulates.
The average stock allocation of investors is presently close to 50%, which is the second-highest level in history. Equity prices will fall over the next decade unless investors maintain a larger stock allocation (which I believe is improbable) - by about 4% each year over the next decade.
2. The US consumer sentiment index from the University of Michigan goes back to 1952 . It has never been lower than it is today.
3. Earnings Recession . With the first quarter earnings season nearly complete (97% of companies reported), S&P 500 earnings are down 14% versus Q4 2021 and up less than 1% year-over-year.
4. Critical shortage . The baby formula shortage continues to worsen, with 74% of stores across America out-of-stock (a year ago the rate was less than 5%). 10 US states now have out-of-stocks rates that are 90% or higher, including the most populous state (California).
5. U.S. Inflation
Dec '20: 1.4% (Trump's last full month in office)
Feb '21: 1.7%
Apr '21: 4.2%
June '21: 5.4%
Aug '21: 5.3%
Oct '21: 6.2%
Dec '21: 7.0%
Feb '22 : 7.9% (Putin invades Ukraine)
Apr '22: 8.3%
6. Walmart is making offers in order to sell some stock that they have , which may change the psychology of the clients making them think that the quality is becoming worst and also becoming hard to rise prices in the future.
All these points combined (inflation + shortage + fewer earnings + lower consumer sentiment + people investing money they cannot afford to lose) make me think that investing in Walmart right now can be an 8-10 years trap where you would lose even less by just leaving your money under your bed.
7. The technical analysis neither seems good as you can see. With all these conditions is something expectable that Walmart goes at least to the 61.8 Fibonacci level or even to 55$ per share...
This is not a recommendation for buying or selling, this is just an analysis to make people have a more global vision before falling into the traps of the people that invite you to buy at this level.


WMT Supply / Demand (possible scenario) Please take a look at the chart (zoom in and out to see it clearly)
Currently WMT is located in the demand zone, the best time to enter in my opinion -when WMT close above demand zone for the 2nd time, as you can see it usually move (close) above the demand zone
then dive back in to demand zone, then "dance" in the demand zone -showing higher lows and when it moves out for the second time above demand zone and close above it ,that when the rally begins .
Not financial advice.

Do you have a Reward to Risk ratioIn the world of trading, do you know what a Rw/Rs (Reward to Risk) ratio is? if you dont this article will be beyond your understanding. I suggest you read up on Reward to Risk ratio & come back to read this. If you do know what a Rw/Rs ratio & assume most of you do, we can continue our merry trade discussion ;D
My Rw/Rs ratio for Swing trades that i take on a Weekly (W) chart is factor of 4 to 6, am happy to see more. with my Day trading strategy; am a little more aggressive & will settle for a Rw/Rs factor of 3-4 to take on a day trade.
Once a while, a trade opportunity arises that offer such a large room for Reward to run, as in this (W) chart of WMT WalMart Corp. if the trades goes my way, look at this room for profit to run, with no resistance of supplyzone in sight this can go up.....sweet mama, she got my attention.
First; (Disclaimer) I will never take a trade solely based on a sweet Rw/Rs the odds are not in my favour. Back to the trade. So i have a sweet Rw/Rs ratio what else is going on? Price is crashing into a DZ from the (M) & this DZ happens to be the HL of the month (M) uptrend. This is good, The week (W) price chart is into the long-term chart DZ (Demand zone). This qualifies only if the (M) is still in a technically defined in uptrend. This is a Classic trade set-up I love.
Like a Snipper I set my LNG (long) entry at 117 level slightly above the lower band of the DZ, my entry was so low that my risk was less than a dollar before my STP triggers. I took the Long position, the market rallied & so did WMT, & I closed 1/2 my position once price reached 128, I took a good 10 Rw (Reward) pressure if off. already the trade made its money. & I let the 1/2 of the position run. Lets see how it goes when the market is open on Monday. This was a swing trade using the (W) chart to identify the setup. Long-term would be the (M) chart & I used the (D) daily chart to enter & set my STP.


WMT oversoldOversold on several indicators but still trading above the cloud overall, looking for a bounce to $131-136 in coming days. Bought 90 June 24th $125 calls

WMT no change in view, WAY OVERSOLDAdded further to my calls today to a max position. fib .236 is $128.52, .382 is $134.56 retracement most common is .618 $144.49/ Way oversold on several indicators with gap to fill, expecting a 50% retracement of gap. I have 105 June 24th $125 calls. GL

WMT-BUY strategyWe are basing well and we are slowly starting to go higher.
The GANN Fan resistance which coincides with FIB. is near $ 128.00. I would suggest take profit on longs near that area, and perhaps $ 126.75 - 127.25.

make or break area for Walmart >.<WMT at a trend support that has held for so many years! will it bounce again or finally break?
bad news for longs if we don't hold this support, long trigger at 128.21, short trigger 115.40


WALMART - time to watch for reversal?A flat structure on daily, as an option. Wave C traveled 1,618 of the distance, covered by wave A.
This is a nice level for a reversal. Need a confirmation


Strong correction for WMT!!After the earnings report WMT fell over 10% and that is every bears dream especially as we may be entering a bear market things are looking bleak. However there is a difference in a healthy bear market where money is lost gradually and isn't lost 10% overnight. so as the overall long term position on Walmart right now may be bearish the short term for this next wee may be a correction up to the 125$ region on Monday and we can see whether the bulls can break that and jump it up to around 130-135$ area.

WMT selling off cools downThe down trend is broken in 15min chart, there are signs the stock is bottoming or near bottoming for the short term.

Long WMT Long WMT after a crash down to the 76 fib. Always love to buy these. Breaks of 76s can turn into capitulation so stops here always go just a bit behind there.

Walmart...more down to go?WMT is showing a down trend that appears to continue tomorrow and possibly later. I would expect it to flirt with $119.55 tomorrow. If it goes below that price It could go as low as it was in 07/2020. This is not financial advice. I will be looking at more puts for day trades on WMT using the flawless day trading strategy. This is chess not checkers so I will be looking at JULY 1 plays.
