Trade idea on Walmart - WMTJust as an idea: Cash secured put on Walmart, with a strike price of $134 (delta 23) and an expiry of Feb. 18, 2022. Trade would to be closed on Feb. 16, 2022, 1 day before the quarterly results, which will be published on Feb. 17, 2022, before market opening. The $134-$135 area has successfully acted as support four times over 1 year. Whether it will do it another time is of course uncertain! The additional purchase of the cheaper put with strike price 115$ reduces the margin and creates a bull put spread. This trade idea is one of the 222 trade ideas from my book "The Stock Market Year 2022: Which stocks go up and when?"
Disclaimer:
This trade idea is for educational purposes only and does not constitute investment advice or a solicitation to buy or sell securities or financial instruments. Investment in securities and financial instruments (especially options) are generally associated with risks, up to total loss of the invested capital and above. I am not a financial advisor. Please do your own research and make your own decisions.
WMT trade ideas

WALMART, sell short and I don't recommend to keep itsell short I don't recommend to keek this stock we have a pullback after a long uptrend

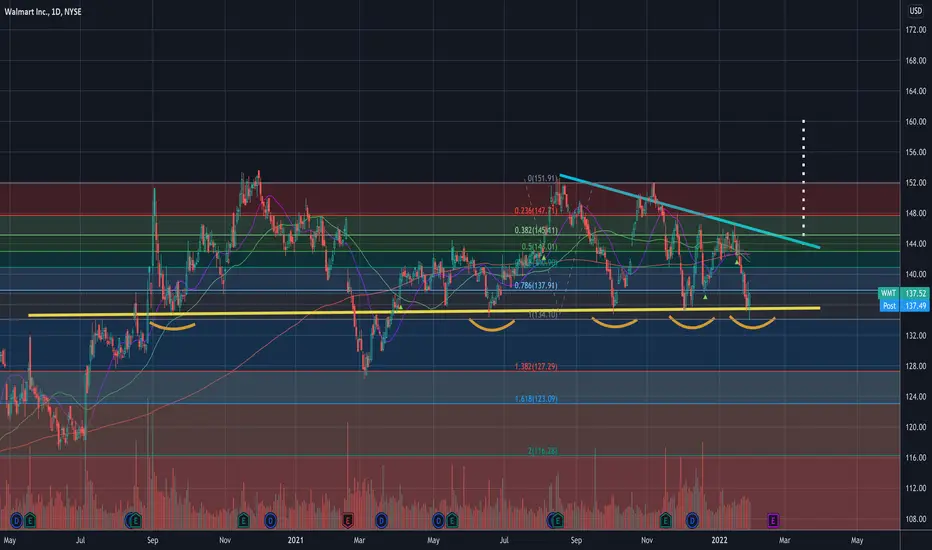
$WMT - Can we get a reversal?A lot has happened since the last chart was published. Past 2 weeks has reshaped the pattern.
The price is currently sitting on lower trend line of a descending wedge at around $135 area. $135 has provided as support prior 3 times and it provided support again in today's trading session.
It may be a signal that reversal could be happening and the price could again travel towards the upper trend line area of around $144.
If the price breaks above $146, we can expect the price to travel to $151 which is prior all time high. If the momentum allows, we can see $160.
Anything is possible in this volatile market. If the price breaks below $135 support, we can expect to see $127.29.
Bullish Target 1 - $144
Bullish Target 2 - $151
Bearish Target - $127.29 (If the price breaks below $135 support.)
———————————————————
How to read my charts?
- Matching color trend lines shows the pattern. Sometimes a chart can have multiple patterns. Each pattern will have matching color trend lines.
- The yellow horizontal lines shows support and resistance areas.
- Fib lines also shows support and resistance areas.
- The dotted white lines shows price projection for breakout or breakdown target.
Disclaimer: Do your own DD. Not an investment advice.

WMT - Bounce of Lower End of Symmetrical TrianglePrice has been in a symmetrical triangle for the past several months as it takes a breather from the prior uptrend. It is currently at the lower end (support) of the triangle and looks likely to bounce (it has bounced off this support thrice before). The stock could have a lot of potential upside, especially if the symmetrical triangle breaks out past resistance in the coming months. That being said, broad market sentiment is quite bearish so I wouldn't be too surprised if support doesn't hold here. I would be a little patient and wait to see where price opens tomorrow; if it opens at or above $139 and seems to be holding that level, I would look to enter long. PT#1 is around $148-$150; PT#2 is $163; PT#3 is $180. Place your stops at $137.
Although it is still a bit early to call, numerous indicators(inflation, stark overvaluations, rising debt, massive market speculation, ukraine tensions, etc.) suggest that the economy could be heading into a recession. Walmart, being an essential big-box retailer, is one of the stocks that has the ability to weather recessions, an ability it has demonstrated several times in the past, so it could be a relatively safe long position for the coming months.

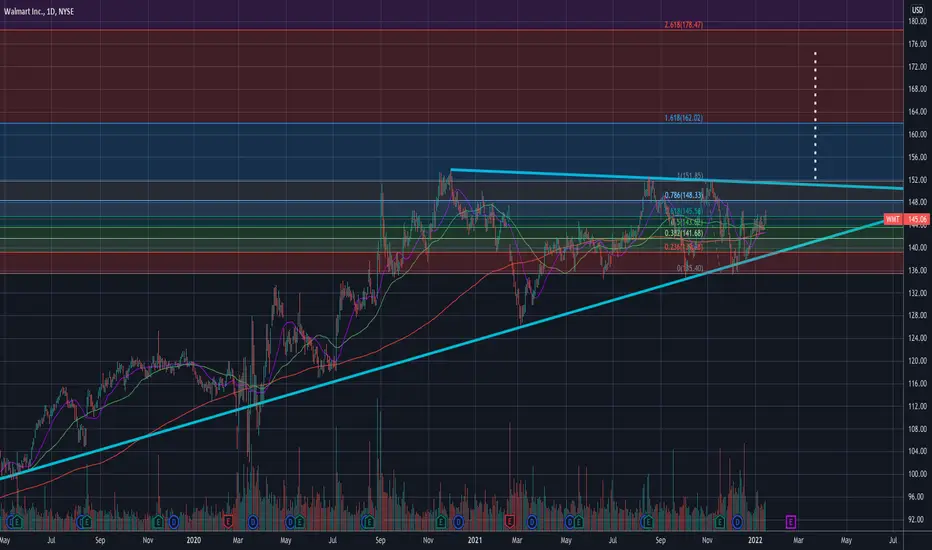
$WMT - Ascending triangle breakout watchWalmart is in ascending triangle and heading towards upper trend line. If the price break above $152, we could get to $175.
Target 1 - $152
Target 2 - $175
Risk - Failure to break above $152 and retrace to $139.
Near term resistance is $146.
———————————————————
How to read my charts?
- Matching color trend lines shows the pattern. Sometimes a chart can have multiple patterns. Each pattern will have matching color trend lines.
- The yellow horizontal lines shows support and resistance areas.
- Fib lines also shows support and resistance areas.
- The dotted white lines shows price projection for breakout or breakdown target.
Disclaimer: Do your own DD. Not an investment advice.
WMTDaily Chart Report
WMT is finally in the process of breaking out. It has been consolidating at the breakout level for over a week now. It did its first close above resistance today when the rest of the market was down. WMT is headed to the 152 resistance level.

Walmart - Inverse Head and ShouldersInverse Head and Shoulders setting up at the neckline. If the bulls win then we should see a huge pop off the 50 moving average.

Symmetrical Triangle / RectangleWMT appears to be inside a triangle that is inside a rectangle. So there will be resistance at the top trendline of triangle and from the rectangle as well as support below.
Both of these are neutral patterns until a trendline is broken with a trend in that direction.
No recommendation. Three bottoms are close in price at bottom trendline of rectangle. There are also 3 tops that are close in price.
spinning top today and a Doji yesterday. Both are candles of indecision.
There have been 4 touches and a partial touch. Many times I have seen the 5th touch or swing in a triangle to be the charm but WMT remain inside for now.
wait for breakout/breakdown confirmation 🍿Walmart chart kind of reminds me of the $SNOW setup in a way, stuck between extreme trend support and resistance just like snow was before the big dump this week.
It will continue to be choppy until we get a clear breakout past one of the trendlines.
over 149 target 154, below 139.25 target 135
like and follow for more 💘

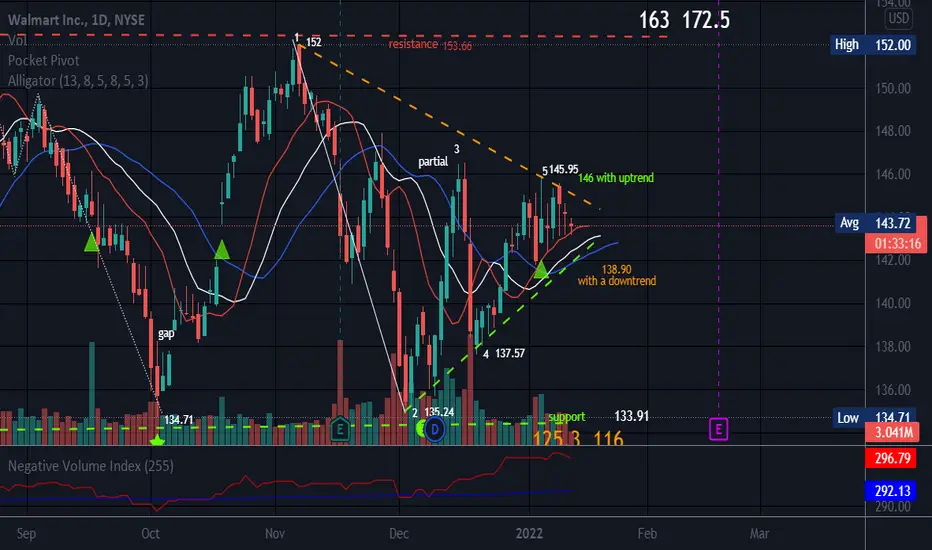
$WMT Bearish FOMC Setup 1/6/2022$WMT had a parabolic run up on 1/4/2022 with little to no consolidation. Elevator up means elevator down. It is also about to break back into the triangle trend it was forming. Also Dec 16-17 $WMT fell almost $8 and can also be considered a gap fill for $WMT coming back into trend, as shown by the green boxes. This play is puts under 143.60 (risky) or 143.00 (safe) for confirmation of downtrend break. Sell would be when $WMT touches support lines with only runners after that. $SPY confirmation is encouraged but not necessary because $WMT tends to move on its own.

WMT DailyEarnings mid February
VWAP 142.93
America's largest retailer by sales, Walmart operated over 11,400 stores under 54 banners at the end of fiscal 2021, selling a variety of general merchandise and grocery items. Its home market accounted for 78% of sales in fiscal 2021, with Mexico and Central America (6%) and Canada (4%) its largest external markets. In the United States, around 56% of sales come from grocery, 32% from general merchandise, and 10% from health and wellness items. The company operates several e-commerce properties apart from its eponymous site, including Flipkart and shoes.com (it also owns a roughly 10% stake in Chinese online retailer JD.com). Combined, e-commerce accounted for about 12% of fiscal 2021 sales.


Triangle on walmart dailyas you can see there is a triangle on walmart so its a GREAT time to open a long

WMTWeekly Chart Report
WMT on the weekly is sitting right at resistance. A break above 145 can take it to 151 level.


WMT2-2 Rev on the month off the bottom of a BF
2-2 Continuation on the week is also the 2U on the day
If we hit the 2 up Day PT we will trigger the 2U month

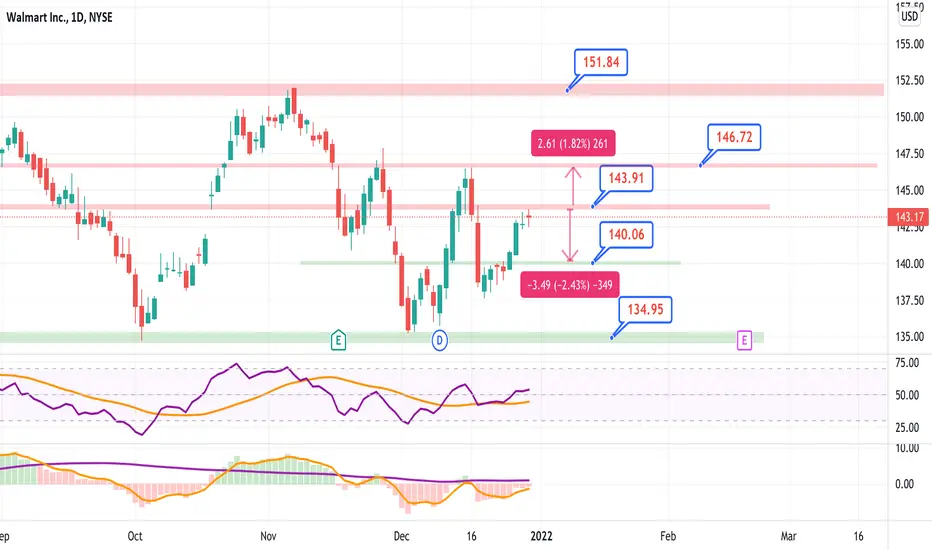
WMTWMT sitting right at resistance which is also the golden pocket. There is a chance for a retracement before it makes the next leg up. If it breaks resistance it will be an easy run to 146. If it decides to retrace you can find support at 140 and then 134.
wmt buyWMT buy .. buy after the break above the resistance level and 200ma at 143.62 .. target point next resistance level 150.57 ..

WMT beginning a Trend UpThis one floated in yesterday morning while attempting to quiet my brain.
It is actually having a good day today, and the guidance is that it could really get going tomorrow (Wed.)
I suspect it'll drop a bit later today, or maybe gap down (small) in the morning and you buy it.
I'm looking for a move up to around $157 topping around Jan. 6th .
Obviously, there could be a larger uptrend, but my work is typically shorter term swings.


"Save Money, Live Better"Walmart forming an Ascending Triangle on the 1 hour, extremely bullish on it if the market can maintain a stable direction. Most likely buying some calls.
