Walmart's Next Stop All Time HighsHello friends, today I am completing a technical analysis on the 1D linear scale chart for Walmart Inc. (WMT), a retail company traded on the NYSE.
In the chart I noted:
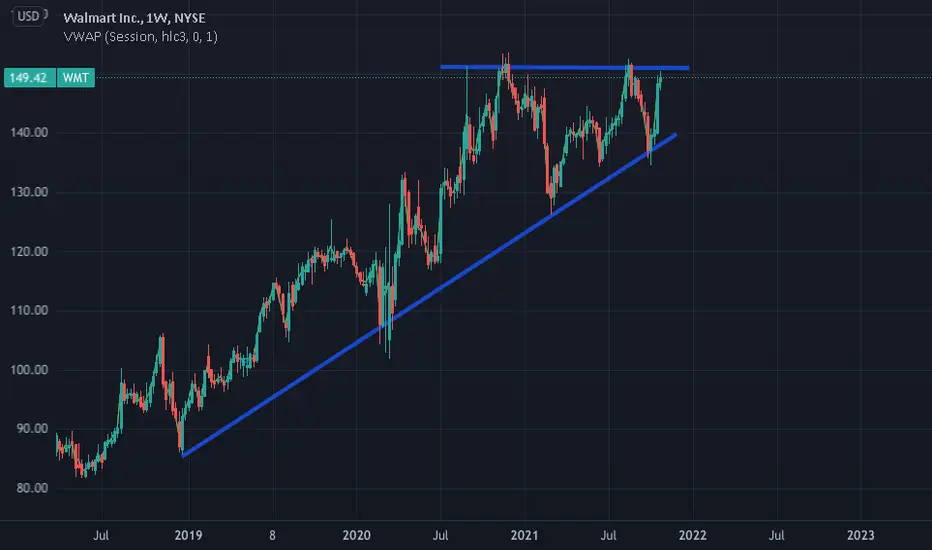
1) The WMT price has been moving in an ascending triangle since December 2020 with the first bottom trendline touch in March 2021. The bottom trendline has been respected two times with the second touch in October 2021.
2) The price is currently looking bullish based on a few indicators noted below. The price has potential to increase 5% or greater and make a new all time high.
3) The 21 Day EMA is hovering at the current price and the price is making an attempt to break it.
4) The Volume looks consistent with prior months.
5) The RSI is respecting the bottom trendline forming a Rising Wedge pattern. There is potential for the RSI to move higher as it recently completed a Double Bottom off of the bottom trendline.
6) The Stochastic RSI (Stoch RSI) is moving out of the oversold region with potential to create a double bottom or move directly higher. If it goes back down to create a double bottom, price may consolidate for a bit before moving higher.
7) The Money Flow Indicator recently exited the oversold region and headed higher. An example of the MFI reaching oversold region is shown in March 2021.
8) The Fibonacci extension showed the price recently re-tested the 0.382 level and currently entering the Golden Pocket (0.618-0.65).
What are your opinions on this?
If you enjoy my ideas, feel free to like it and drop in a comment. I love reading your comments below.
Disclosure: This is just my opinion and not any type of financial advice. I enjoy charting and discussing technical analysis. Don't trade based on my advice. Do your own research! #cryptopickk
WMT trade ideas

Walmart (WMT) - A Potential Pullback to About $130?Hello all,
Walmart is showing a clear double top formation and has gone under its 20 week SMA. In the last few years, this has signaled a pullback of about 10% being in the cards, though I have circled in bright green 3 incidents where this did not take place. The double top formation, the historical trend, as well as the recent strength of tech stocks, and the inflation scares leading to a weakening of performance in retail/consumer stocks all lead me to believe that a pullback to $130-$135 is highly likely.
All the best,
Jason

My outlook over the Walmart stock My outlook over the stock
▪️From a Technical Perspective, there might be 2 entries, as marked on the chart. It will depend on what type of trade you are getting in - is it an underlying asset or CFD, is it short or long-term trade, and so on.
Price mice drop as it did previously to a point which I've marked as Entry #2, but it might not even go there
▪️Fundumentaly speaking
According to history, WMT did great during the high inflation period in 1978-80, while the whole $DJ30 was down 20%
From the last Earnings report company reported great numbers, but more importantly, they assured us that shelves are stocked up and Walmart is fully ready for Thanksgiving and Christmas. The supply issue is the number one concern nowadays in the general market rather than inflation.
We all know according to numbers that the average American spends around 30% more compared to previous years, meaning we should expect great numbers for the upcoming earnings reports.
I'd recommend holding the stock for the long or mid-term, but it might give us a great opportunity for the short term as well.
Good Luck Fellas
☮️

Walmart Holiday Breakout Imminent?Walmart has been consolidating in this ascending triangle for over a year now, posting consistently higher lows, but unable to clear ATH . Walmart traditionally has a very bullish holiday season and this could act as a catalyst for a break out of structure above ATH . I see two possible scenarios occurring, both bullish .
If we continue to see similar volatility in price action to the most recent selloff, then we could easily break above resistance before mid December. ADX is calling a breakout on Dec 3, but if this theory is correct we would most likely see that happening before the 10th or so. The other option is we return to typical price action we have been seeing in these big moves for the past year within structure, which would put us in position for a breakout late February to early March.

$WMT Wallmart is in downtrend$WMT Wallamrt is in downtrend.
Analysis:
- Wallmart is in downtrend from Resistance
- Wallmart is currently $144
- An RSI Divergence occured last week
TAKE AWAY:
- WATCH for the mid level support, if it breaks expect the stock to lower to Support
- If Wallmart bounces off the mid support it will rise to resistance again.

Walmart ~ $WMTWalmart looks ready to continue going on the Weekly timeframe.
Could see this potentially around 170-200 bucks at some point in the near future.

WMT in daily time short potionwmt is good potion short
sell good rivard to risk
Failure of static and dynamic resistance and good price

Walmart | Fundamental + Technical Analysis | MUST READ ! 🔔Welcome back Traders, Investors, and Community!
Check the Links on BIO and If you LIKE this analysis, Please support our Idea by hitting the LIKE 👍 button
Traders, if you like this idea or have your own opinion about it, please write your own in the comment box . We will be glad for this.
Feel free to request any pair/instrument analysis or ask any questions in the comment section below.
Have a Good Day Trading !

WMT analyse . i think it will go down . it's already confirmed by the rejection in the H4 timeframe . That's My Personnal Opinion. Hope You Like it .

WMT Weekly Options PlayDescription
WMT double rejection off 150, a decisive close below this level triggers a short position.
Using A put debit spread, because profits are always limited by time.
Put Debit Spread
Levels on Chart
SL > 150
*Stops based off underlying stock price, not mark to market loss
The Trade
BUY
11/26 148P
SELL
11/26 135P
R/R & Breakevens vary on fill.
The long call is placed ATM for higher chance of profit,
The short call is placed at the 135 support level.
Earnings on 16NOV are a risk factor
Manage Risk
Only invest what you are willing to lose

WMT shortEntry price: 150-152$
Target price: 135-137$
Stop loss: 153-155$
Chart pattern: double top - the price formed the second top, thus the price reversal is very likely
Candlestick pattern: bearish engulfing
RSI: approaching 70 level, therefore, the price is almost overbought
Conclusions: the chart pattern, candlestick pattern and RSI suggest the trend reversal in the near future. Thus, the short position is recommended with the stop loss above the resistance level.
No financial advice


WMT potential breakout. Holiday pump???WMT, forming a wedge. MACD has crossed over so expect some bullish movement. It needs to break above $153 to see $158

walmart wmt analysis 1 stock walmart in supply zone
2 we do not have big volume so he can not break supply zone
3 walmart in overbought zone on indicator
4 walmart will down to demand zone
5 after will arrive to supply zone
6 good luck

WMT Long Option Call Option Call Strike Price 155 11/12 @38>
Feel free to buy contracts for other strike prices 150-153 for the same expiration.

WMT trade Opportunity Very simple, over 153 long/under 137 short. Wmt has also been trading in an uptrend for about 15 days so if 150 does get rejected and the 15 day trend line breaks then shorting wmt to 140 wouldn't be a bad idea
WMT to pass 152?They're gonna tank on earnings day got a feeling it's gonna go up until that day. Then break highs after the earnings drop.

WMT bouncing from demand zone to 145-150 againWMT is a defensive stock, which could be a great Buy in uncertain conditions of the market. I see it could climb back to 145-150 in a couple of weeks.
Entry price - 137
Target - 145-150
Stop-loss - 134
Position size - 5% of the capital
Period 4-6 weeks

#WMT: Buy the dip...There is a monthly and weekly uptrend in $WMT, and I like the reward and odds here vs the risk. I'm long using long term OTM call options here (June 2022 $165 calls), risking a palatable amount on call premium. Doing this, you can look into selling shorter duration calls periodically, or going short stock against the position to try and make the trade risk free. It's a good strategy if you have a knack for trading, while riding a big trend.
I like the fact that Ray Dalio recently lost a big pension fund from his list of clients, and one of his top holdings is $WMT...as a bit of contrarian color. Alternatively you can trade this one with shares, as a long term position with no stop, it should work if it holds over $142-140, the signal implies a rally over $167 by May 2022, perhaps can reach target #2 at $198.
My last trade was the yellow box you see on chart, a daily signal which generated a bigger monthly trend trigger. This entry now is the optimal entry to rejoin the trend (near my original entry). I sold the shares near the highs already.
Cheers,
Ivan Labrie.

Breaking highsPrice keeps breaking highs in a massive downtrend. The time is now to buy. Not to mention Walmart is now competing against amazon with their added feature of walmart plus for fast delivery and shipping and discounts and walmart food delivery is massively cheaper than whole foods by amazon.

WALMART : CMP 138Stock only Going through Timewise Correction on daily timeframe....Can go long after breaking 145 for target 200 with SL 135

Double Bottom?Earnings November 16th. There is a gap below price where support may be found or perhaps under lower bottom.
WMT appears to have encountered resistance from a prior gap down, and possibly from the 200 SMA. Moving averages can provide support and resistance levels. There will most likely be resistance at the top of that gap as well. Moving averages are lagging indicators. Price is a leading indicator. The 20 Daily SMA which is the shorter moving average on this chart and is blue, has crossed down through the 50 and the 100. The 3 longer term moving averages, the 50, 100 and 200 are where they should be, but price is underneath these moving averages. The moving averages need some work for sure.
The top wick of today's candle is a bit long and can point to volatility and a struggle to break a resistance level. Both support and resistance levels were made to be broken or price would never move or would be in a tight range all of the time. Bollinger bands are not on this chart but price came close to the bottom band set on an 80 SMA. Price pierced the bottom band when set on a 20 SMA which is the normal setting for bollinger bands.
If price pierces the top trendline of the gap, chances are the gap will fill as there is no recent price action inside the gap.
3 candle pattern before todays green candle which gapped up. 3 Inside up consists of a bullish Harami (Candle 1 is a red candle with a smaller green candle the next day and the body of the 2nd candle fits inside the red candle) Then a third green candle which some use as confirmation of the Harami. Harami's can also be bearish and and are a 2 candle pattern. In a bearish Harami the first candle is a good sized green candle followed by a smaller red candle that fits inside candle #1. The confirmation candle, 3rd candle, would be a red down candle confirming the bearish Harami and this is called 3 inside down.
RSI is at 46.16 and pointing up. Some prefer the RSI to be over 50 before entering a trade. The RSI is not on this chart but I checked it.
No recommendation.
Negative volume has turned up and short percent is 1.13% (low). Possibility that gap will fill next rainy market day or top trendline of gap will be tested.

WMT Long Swing IdeaWMT Long Swing Idea
Strong support thinking the rebound will happen along with strong seasonality and Holidays coming.
