WMT eyes on $93.38: Golden fib that may mark Lower High of a TOPWMT price holding up well despite the tariffs, or is it?
Rejected by Golden Genesis (from birth) fib at $95.68
Bending under Golden Covid (stimulus pump) at $93.38
First support below is at $88.04-88.50
Strongest support below is $84.72-82.05
WMT trade ideas

WMT - Walmart#Walmart is considered a defensive stock and could be a solid choice during a bear market or recession.
In my view, $85 is a reasonable entry point for #WMT.
As always, do your own due diligence before making any investment decisions.

Walmart (WMT) shares reach highest level since early MarchWalmart (WMT) shares reach highest level since early March
As shown on the chart of Walmart (WMT) shares, trading closed yesterday above the $94 mark – a level not seen since the beginning of March. This means that since the start of 2025, Walmart’s share price has risen by approximately 5.5%.
This positive trend stands in stark contrast to the S&P 500 index (US SPX 500 mini on FXOpen), which has declined by more than 8% over the same period.
Why are Walmart (WMT) shares outperforming the index?
Apparently, from the market’s point of view, this is due to the fact that Walmart’s supermarkets are a source of essential goods for Americans, giving the company an advantage in a scenario where the US economy may slide into recession.
According to Mizuho Bank analyst David Bellinger, Walmart is a sensible choice for investors trying to stay afloat in a volatile market. He forecasts that WMT’s share price could rise to $105 – around 15% higher than its current level.
Bellinger notes that Walmart continues to attract price-conscious shoppers and has made significant progress in e-commerce, helping the company remain resilient even amid the prospect of economic slowdown.
Technical analysis of Walmart (WMT) shares
The chart shows that the share price is moving within a long-term upward trend. The black dashed line, which had acted as support for many months, has been broken:
- This suggests that the line may now act as a median.
- Allowed us to widen the channel and find its lower boundary, which is expected to offer support.
Indeed, the lower boundary of the expanded channel provided support in the first half of April, with particular attention drawn to the large bullish candlestick on 9 April (marked with an arrow). According to the NYSE, over 46 million shares were traded on that day – more than twice the average volume. This highlights the strength of demand.
It is possible that WMT shares may continue to outperform the index going forward, forming fluctuations while:
- receiving support from the psychological $90 level (previously a resistance point);
- gradually approaching the median of the aforementioned channel.
This article represents the opinion of the Companies operating under the FXOpen brand only. It is not to be construed as an offer, solicitation, or recommendation with respect to products and services provided by the Companies operating under the FXOpen brand, nor is it to be considered financial advice.

Walmart Holds Strong and Ends the Week Up More Than 15%Shares of retail giant Walmart have risen more than 15% over the past five trading sessions, despite growing tensions over reciprocal tariffs between China and the United States. The bullish bias has remained intact, primarily because the company stated this week that it is prepared for scenarios with tariffs of up to 125% on Chinese imports and is currently negotiating with suppliers to secure better pricing in the coming weeks. This has helped preserve investor confidence and positioned Walmart as one of the few stocks that has withstood the volatility of the renewed trade war.
Building Bullish Momentum
This week’s price action showed a sustained upward bias, suggesting the beginning of a new short-term bullish trend. However, Walmart's stock still faces resistance from a key Fibonacci retracement level, which it must overcome to confirm a strong buying momentum and possibly maintain a bullish trend in the coming weeks.
MACD Indicator
The MACD currently favors the bulls, as the histogram has expanded significantly, reinforcing the upward momentum above the zero line in the short term. As long as no divergence emerges between price action and the MACD, there’s little room for meaningful selling corrections in the immediate sessions.
ADX Indicator
The ADX line is beginning to show some indecision, as it gradually descends toward the neutral 20 level, just as the price approaches key resistance zones. If this downward trend continues, the market could shift into a more neutral phase. However, for now, the indicator still supports the idea that the recent upward moves reflect a solid directional bias.
Key Levels to Watch:
$95: Likely the most important nearby resistance, aligning with the 61.8% Fibonacci retracement level. A decisive move above this area could open the door to a stronger bullish phase.
$104: A long-term resistance, representing the recent highs reached in the past few months. A return to this level could revive the broader bullish trend that had been dominant in the past months.
$85: A key support level, aligned with the 200-period moving average. If price retraces back to this level, it could reactivate the bearish bias seen in previous weeks.
By Julian Pineda, CFA – Market Analyst

Walmart Withdraws Earnings Guidance Amid Tariff UncertaintyWalmart (NYSE: NYSE:WMT ) has withdrawn its operating profit forecast for the current quarter. The company cited tariff-related uncertainties as the reason. Rising import duties from countries like China and Vietnam have impacted cost structures. Walmart aims to keep pricing flexible to protect margins.
Despite the near-term challenges, Walmart reaffirmed its full-year guidance. The retailer expects net sales to grow between 3% and 4%. It also sees adjusted operating profit growth between 3.5% and 5.5% for the year.
Walmart highlighted additional concerns, including insurance-related costs and shifts in consumer behavior. Shoppers are spending more on low-margin essentials due to inflation. This change in product mix has also pressured the company’s margins.
CEO Doug McMillon said Walmart will continue focusing on pricing discipline, inventory efficiency, and expense control. He admitted that the current environment remains unpredictable. However, the company will stick to its long-term strategy.
Technical Analysis
Walmart’s stock is currently trading at $90.46, up 10.53%, with a high of $90.80. The price has bounced from a strong support zone near $82, forming a bullish momentum candle. NYSE:WMT is now testing a resistance area at $89, previously a demand zone.
A successful break and retest could lead to a rally toward the $105.30 previous high. However, rejection at this level could see the price fall back to the $82 support. But with the recent bullish momentum, a breakout at $89 is possible.

WMT Approaching Key Resistance! Will It Break Above $90?🧠 Price Action & Market Structure:
WMT has made a powerful push off the $84 demand zone after forming a CHoCH reversal and strong impulsive candles. The 1-hour chart shows a clean breakout from the falling wedge structure, confirming bullish intent. Price is consolidating inside a smaller green SMC supply zone just under $89. Watch closely for either a clean break above $89.11 or rejection from this level.
🔍 Key Support and Resistance:
* Immediate Resistance: $89.11 (local high)
* Next Resistance: $90.00 psychological + Gamma wall
* Support 1: $87.00
* Major Demand Zone: $84.00–$85.00
📈 Indicator Insights:
* MACD is neutral after prior bullish momentum.
* Stoch RSI shows slight cooling, nearing midrange after previously being overbought.
* EMAs are stacked bullishly with 9 EMA above 21 EMA – trend remains intact.
📊 GEX (Options Sentiment) Breakdown:
* Highest Positive GEX: $90.00 — CALL Resistance / Gamma Wall
* Highest Negative GEX: $91.00 — PUT Wall
* Options Flow Sentiment:
* IVR: 58
* IVx avg: 29.5
* GEX: 🟢🟢🟢 (very bullish)
* Put/Call $ Flow: Only 0.2% in PUTs — very bullish
📌 Trade Scenarios:
Bullish Breakout:
* Entry above $89.20
* Target: $90.50 → $93
* Stop Loss: Below $88.25
Rejection Play (Fade Gamma Wall):
* Short from $89.00–$90.00 if candles weaken
* Target: $87
* Stop Loss: Above $90.50
🔮 Outlook:
WMT is showing strength and positive sentiment in the options chain. As long as $87 holds, the bias remains bullish. Break and close above $90 could lead to gamma squeezing toward $92–$93.
⚠️ Disclaimer:
This analysis is for educational purposes only and does not constitute financial advice. Always do your own research and manage risk accordingly.

WMT: Short sell opportunity!WMT: Short sell opportunity!
-Quasimodo level.
-Key level and supply zone resistence.
Ready for the short!

Idea #100 - In this market, it BETTER be a good one: LONG WMTIt's been a while since I posted an idea and to those who follow me I am sorry/not sorry. I didn't post for a few reasons:
1) I know that there are people who trade my ideas despite my warnings/disclaimers and I didn't like how the market was acting for the last couple of weeks (rightly, as it turns out) and I didn't want anyone else to get caught up in this unnecessarily. I have been continuing to personally trade my system, with mixed results (to be expected in this market), but I wanted to make #100 a good one.
2) I wanted to do a summary of the ideas I've posted so far with #100 and wanted to get that information together first.
3) I think posting this now can provide some insights as to how to deal with market washouts calmly and with confidence, with things that could apply to most trading systems, I think.
So first, lets deal with the idea at hand. I chose WMT because:
a) it is historically a top 10% stock in terms of daily % return for how I trade, so if anyone decided to follow me on this trade (see disclaimer below), it was at least a stock that has historically done well. And by well, I mean 1355-0 W/L record well, with an AVERAGE gain of 5.16% per trade for all 1355 trades (backtested and actual trades combined) going back through every market meltdown since 1972.
b) This is the kind of market that makes it FAR more likely that trades will take a long time to play out. MUCH longer than average. So again, if I have to hold this a long time, I want a quality stock that has a long track record of surviving long downtrends in the market. I can't think of a better retail stock to own during a recession, which I think is a certainty at this point, it's just a question of when it becomes official and how long it lasts. WMT is already the retailer of choice for many, and if saving money becomes a requirement for many more, WMT will steal a lot of business from more expensive retailers.
c) despite the recent carnage for it and the market, WMT is still above it's 200d MA and solidly in an uptrend. I always like trading stocks in uptrends. Hopefully it stays in one long enough for me to make my money and run.
Lot 1 opened today at the close at 87.82
Per my usual strategy, I'll add to my position at the close on any day it still rates as a “buy” and I will use FPC (first profitable close) to exit any lot on the day it closes at any profit.
As always - this is intended as "edutainment" and my perspective on what I am or would be doing, not a recommendation for you to buy or sell. Act accordingly and invest at your own risk. DYOR and only make investments that make good financial sense for you in your current situation.
_______________________________
So there's my case for WMT. Now here's the case for why I'm trading anything using my system right now. The first idea I posted here was on June 22nd of this past summer. Since the close that day, the Nasdaq's return is actually negative (-1.48%) and the S&P 500 is up marginally (+2.7%).
Since June 22nd, I have logged (timestamped) here every buy and sell of every lot of every idea since then. That amounts to a total of 330 lots traded. In the time since, 289 of those trades closed with a gain, 37 are still open and negative, and two were opened today (this one and an add to RDDT) which are neither winning nor losing yet. That's an 87.6% win rate so far.
INCLUDING the 37 trades that are losers right now (the losers include 8 lots that are down 30% or more and two options trades that each lost 100%), the AVERAGE return on those 330 trades is +1.88% EACH. That translates to .11% per day held - almost 3x the long term average daily return for stocks and almost 8x the average daily return of the S&P 500 since June 22. Annualized, that's 27% rate of return and I was on pace for a 36% annualized rate of return on these trades before this market swoon hit. Compared to -1.48% and 2.4% for the indices, it's been a pretty good 9 months of trading, but actually below my system's long term average.
The profit factor on these trades (including the open losers) is currently 1.98 (it was over 2.5 2 weeks ago before the market collapse began). The average holding period is 17 days, but that is skewed longer by 10 lots of PXS that I've been holding for over 4 months each. The median hold length for all 330 trades is 5 trading days and the most common holding period (including the 37 still open losers) is ONE trading day.
OK, this turned out to be a longer post than I intended, so I'll post another idea tomorrow with some thoughts about dealing with trading in down markets.
To everyone who is reading this and especially those who are following me - thanks for the follows and for taking the time to read this whole thing. Be safe trading out there!

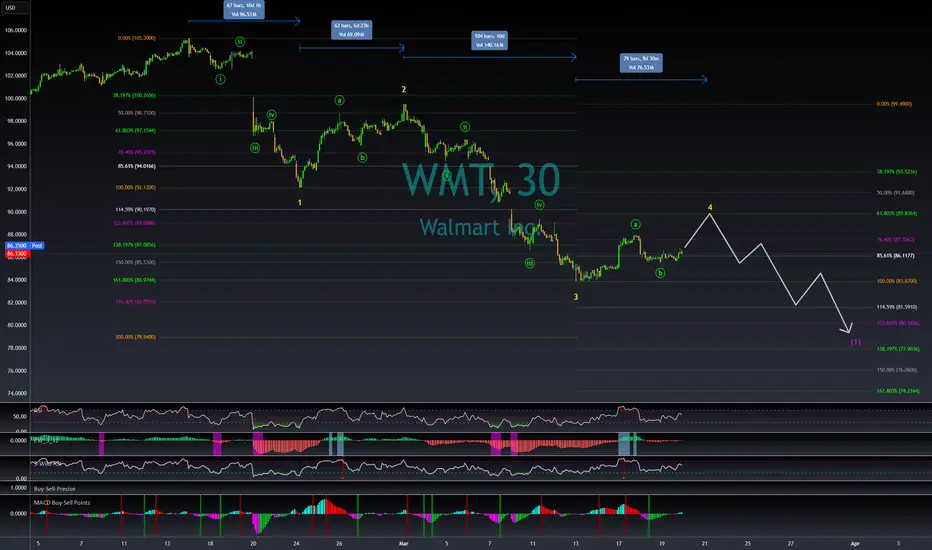
Walmart and Elliott Wave PrinciplesOur Green Wave 2 was a Flat and we could expect a Zigzag for the 4th Wave(Green). Zigzags have 3 waves just as Flats but they do not allow their B Waves to go beyond the previous impulse-- in our case Wave 3(Green). A retest and confirmation at the 161.8% Fib would trigger a Wave C(Red) and on its completion, would be named B(Black). A retest around the Fib 261.8% would trigger a Wave 4(Green) or C(Black).

WALMART: Recovery will take time but it's worth the investment.Walmart is headed to an oversold condition on its 1D technical outlook (RSI = 36.324, MACD = -2.580, ADX = 37.504) but remains marginally neutral on 1W (RSI = 45.418). Based on its 13 year Channel Up and the 1W RSI pattern, it got rejected on its top but this 2 month decline is a usual correction inside this Channel. In fact we do expect the 1W MA50 to break but most likely the trend will find support on the Channel's middle trendline and start to gradually recover in 2026. The recovery process will be long but the prices are already to low and oversold, still one can wait for the 1W MA50 to break in order to confirm that, and buy for the long term. After all, the stock gained more than +160% in less than 3 years and an investment on the world's biggest groceries company with such amazing return, is a worthwhile one. Our target is $140 by the end of 2027/early 2028.
See how our prior idea has worked out:
## If you like our free content follow our profile to get more daily ideas. ##
## Comments and likes are greatly appreciated. ##

WMT FORECAST Q2-Q3 FY25Price at a key level rejecting i expect it to go higher
im posting this cause im expecting a recession but grocery is settuing itself up pretty nice

WMT ready to resume drop?My overall thesis is we are in the very early stages of a multi-year decline ultimately with the S&P 500 below 3500. I have been wrong many times before so I will just take this thing in stages and see if it plays out. After this massive decline, we should be in for a great market rally of many decades. I am expecting the market to end its recent rally this week. The current rarely would be about a week in length depending when it began for individual stocks. The rally has done a few important things with its slow and prolonged upward movement, mainly prevents a wave 3 signal from occurring during the next decline.
My wave 3 indicator tends to signal wave 3s and 3 of 3s. See my scripts for the specifics of the indicator. If the market had a short wave 4 up and then a sharp or prolonged drop during wave 5, a new wave 3 signal would occur which violates the currently placed Minor wave 3 (yellow 3). Allowing separation from the current wave 3 signal enables wave 5 to drop quick or slow.
This chart applies select movement extensions based on wave 1's movement on the left and then another based on wave 3's movement on the right. I keep the values between 0%-100% on the chart for wave 2s and 4s retracements of the preceding wave's movement for reference even though the retracement values would be inverted.
Specifically for WMT, Minor wave 3 was longer than wave 1, which does not place a maximum length on wave 5. Assuming wave 4 ends on Thursday or Friday, Minor wave 5 could be a week or longer. In that time, at the very least it should drop below wave 3's bottom of 83.87. Using some basic movement extensions, it will likely go lower. The 5 wave lower pattern for this fifth wave is hypothetical, but a bottom could occur between 74-79. Once we bottom, we should see another rally over a few weeks. I will forecast what that could look like as Intermediate wave 1 nears its end.
Walmart's Oversold Opportunity?Walmart Inc. (WMT) is exhibiting potential bullish momentum, with a notable weekly gap around the $82.50 level. A breakout above the $96.18 level could signal further strength, positioning the stock to target the $105.30 resistance. This trade setup offers an attractive risk-to-reward ratio, with a stop-loss set at $82.48 to manage downside risk.
The Relative Strength Index (RSI) for WMT recently reached 27, indicating oversold conditions and a potential for a bounce. As of March 14, 2025, the 14-day RSI was 27.09, suggesting the stock was undervalued at that time.
Analyst sentiment remains positive, with a consensus rating of "Strong Buy" among 29 analysts. The average 12-month price target is $111.96, indicating a potential upside of approximately 28.88% from current levels. Price targets range from a low of $99.00 to a high of $120.00, reflecting confidence in the company's growth prospects.
Walmart's strong market position, strategic investments in technology, and resilience in various economic conditions support a bullish outlook for WMT, with a potential move toward the $105.30 resistance level.
NYSE:WMT

Bias Upside on WMT until it hit my entry level $80If you're experiencing FOMO, you might consider buying at the current price of $85, which is near the 200-day moving average (MA) on the daily timeframe.
However, I remain biased to the downside, as there is still some room for further decline.
Key Support at $80:
1) 50-day MA support on the weekly chart
2) 61.8% Fibonacci retracement level
3) Psychological round number support
I'm watching $80 as the next support level before making my first DCA entry.

WMT tells a similar story of bubble like othersA Lot of retail & banking stock are showing low volume prices at the top, like WMT, COST, HD,AXP, JPM and consumer discretionary like TSLA, but not so much in other sectors like Energy, Semi.
I think Banking and retail still have a way to go whereas Semi, energy, tech could be close to support
So a lot of the bubble stock were bound to burst. Trump just provided the catalyst and more. Warrren Buffet started selling before last August, thats when the bubble began forming in many stocks from what Volume profile tells me. The big boys like Buffet weren't buying. So the SPX should come back to last August level ie 5200, thinking logically thats where the smart money is waiting to buy. Of course that assumes there is no recession, else it could go lower

WMT Walmart: Has an Important Top Formed?The price may have formed a major top in Circle Wave 3 in the white scenario, which suggests a potential move toward the $20 area as part of a larger Circle Wave 4. For now, the assumption is that a substantial top has been struck, but whether this marks the end of Wave 3 (yellow scenario) or a broader corrective phase remains to be seen.
Key Levels and Scenarios:
In the yellow scenario, the market should be moving toward the support area between $45.60 and $62.87. A strong, impulsive rally from this zone could indicate one final Wave 5 push higher before a major third-wave top is confirmed.
In the white scenario, if the rally from support turns out to be corrective, it may just be forming a white B wave, reinforcing the outlook for lower prices in a prolonged correction.
Current Focus:
The market is currently moving downward in Circle Wave A toward the orange support area.
Since A waves can unfold in either three or five waves, it is important to monitor whether this decline remains impulsive or corrective.
As long as the price remains below the March high (~$105 on smaller time frames), the focus remains on lower prices.
For now, the priority is to closely observe the microstructure as the move down develops, to determine whether the yellow or white scenario plays out.

Walmart on Major SupportWalmart is quite a bit above it's last solid trend line. That suggests it could range out on this support for a while before it does another big move again. But it could also keep on the current trend and run to $145. Either way owning the stock here seems like a good idea.
Good luck!

Walmart Makes a Lower HighWalmart rallied for more than a year, but some traders may see risk of a deeper pullback.
The first pattern on today’s chart is the rising trendline along the lows of August and January. WMT dropped under that support last month and began March turning it into resistance.
Second, prices have breached the 50-day moving average. That may suggest its intermediate-term uptrend is ending.
Third, the 8-day exponential moving average (EMA) has crossed under the 21-day EMA. MACD is also falling. Both of those may signal short-term bearishness.
Fourth, the recent peak occurred at a 50 percent retracement of the initial drop. That may also confirm direction is pointing lower.
Finally, the overall price action may be viewed as the start of an A-B-C correction. Such a pattern could potentially include a push to a lower low. Traders may also eye levels around $85, near a price gap from November 19.
TradeStation has, for decades, advanced the trading industry, providing access to stocks, options and futures. If you're born to trade, we could be for you. See our Overview for more.
Past performance, whether actual or indicated by historical tests of strategies, is no guarantee of future performance or success. There is a possibility that you may sustain a loss equal to or greater than your entire investment regardless of which asset class you trade (equities, options or futures); therefore, you should not invest or risk money that you cannot afford to lose. Online trading is not suitable for all investors. View the document titled Characteristics and Risks of Standardized Options at www.TradeStation.com . Before trading any asset class, customers must read the relevant risk disclosure statements on www.TradeStation.com . System access and trade placement and execution may be delayed or fail due to market volatility and volume, quote delays, system and software errors, Internet traffic, outages and other factors.
Securities and futures trading is offered to self-directed customers by TradeStation Securities, Inc., a broker-dealer registered with the Securities and Exchange Commission and a futures commission merchant licensed with the Commodity Futures Trading Commission). TradeStation Securities is a member of the Financial Industry Regulatory Authority, the National Futures Association, and a number of exchanges.
TradeStation Securities, Inc. and TradeStation Technologies, Inc. are each wholly owned subsidiaries of TradeStation Group, Inc., both operating, and providing products and services, under the TradeStation brand and trademark. When applying for, or purchasing, accounts, subscriptions, products and services, it is important that you know which company you will be dealing with. Visit www.TradeStation.com for further important information explaining what this means.

WMT 99 PUT Exp March 7 (Loss but trade went to my TP)My analysis was correct, but I closed out due to my emotions being high right after a loss I took prior to me getting in the trade. Price rejected off the 50% fibonacci level, broke the counter trend line it made on the 4HR timeframe, and gave me a break and retest below the 200EMA. If I would have held it longer and trusted my analysis then I would have received the reward. Lesson learned.

WMT 99 CALL Exp March 7 (Loss)Initially I was under the impression that price was going to continue back upward due to higher timeframe candles, but later realized the heavy rejection on the 50% fibonacci level at a daily key level. Price gave me a very strong and big wick on the 4HR candlestick showing that buyers lost the battle to the sellers.
So I went to the daily timeframe to see the overall trend direction to find out it was starting to go downward, along with fundamental analysis about WMT dipping soon.

WMT at initial support zoneNYSE:WMT
WMT could be the most important stock to watch currently as it is pushing the dow around right now. Possible bounce is near? Below 95 changes things.

Walmart (WMT) Stock Drops Over 6%Walmart (WMT) Stock Drops Over 6%
As shown in the Walmart (WMT) stock chart, trading on 20th February closed at $97.26, whereas the previous day, the stock was trading around $103. The decline of over 6% marks the largest drop in Walmart (WMT) stock price in 15 months.
Why Did Walmart (WMT) Stock Drop?
The bearish momentum emerged after Walmart’s earnings report, which was actually quite strong, as:
→ Sales growth reached 5.2%;
→ The company exceeded analysts' expectations (earnings per share were 2% higher than forecasts);
→ Walmart announced a 13% dividend increase.
However, WMT stock fell because the retail giant released a profit forecast for 2025 that came in below market expectations. This was attributed to uncertain consumer behaviour and geopolitical conditions. Additionally, investors may have been dissatisfied with increased executive compensation.
Walmart (WMT) Stock Technical Analysis
The chart shows that after the decline, the price is consolidating near support levels formed by:
→ The lower boundary of the ascending channel;
→ Former resistance around $96.
The situation resembles November 2023, when the market also reacted negatively to an earnings report. However, WMT stock later recovered, and a similar scenario could unfold in 2025.
Analytical Walmart (WMT) Stock Price Forecasts
Analysts remain optimistic. According to Yahoo Finance:
→ The average 12-month price target for WMT is $107.25;
→ Of the 42 analysts surveyed, 38 recommend buying WMT stock.
Trade on TradingView with FXOpen. Consider opening an account and access over 700 markets with tight spreads from 0.0 pips and low commissions from $1.50 per lot.
This article represents the opinion of the Companies operating under the FXOpen brand only. It is not to be construed as an offer, solicitation, or recommendation with respect to products and services provided by the Companies operating under the FXOpen brand, nor is it to be considered financial advice.

2/20/25 - $wmt - breaking news2/20/25 :: VROCKSTAR :: NYSE:WMT
breaking news
"the consumer is not doing well"
well fkn duh.
if u own wmt... or cost... and think they r 40-50x pe types that grow MSD at best... NGMI
i'm buying today
NICE
loaded the F back into NXT after doing some backlog work
TSM
more BTDR
gl to all. this tape blows daily for some time. do what u can to stay solvent and in places that don't blow up *cough* pltr.
V
