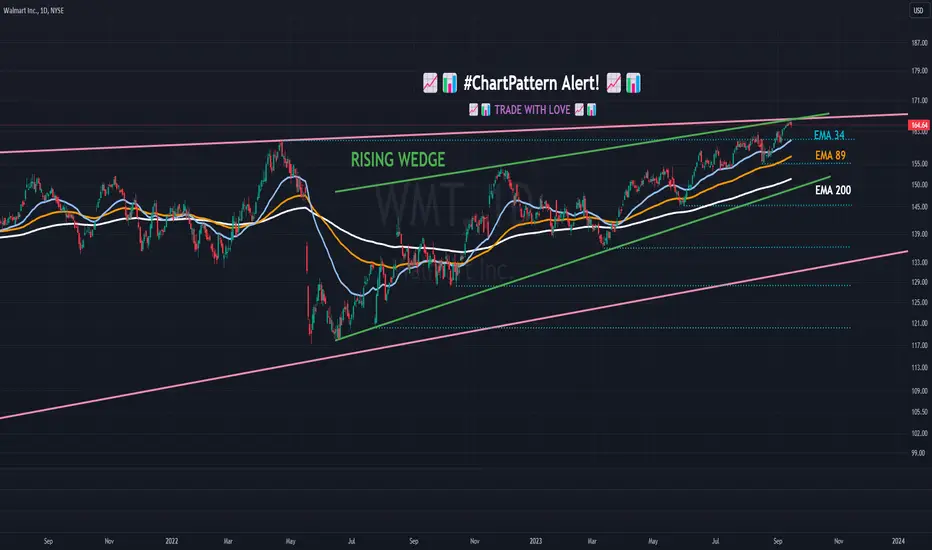
📈📊 #ChartPattern Alert! 📈📊 📈 Rising Wedge 📈📈 What is a Rising Wedge? The Rising Wedge is a bearish chart pattern characterized by two converging trendlines, with the lower trendline sloping upward more than the upper trendline. It typically signals a potential bearish reversal, with the price likely to break downward after the wedge pattern.
📈 How to Identify:
Draw a trendline connecting at least two lower highs (upper trendline).
Draw another trendline connecting at least two lower lows (lower trendline).
📈 What it Signals: The Rising Wedge suggests a potential bearish reversal, with sellers prevailing at lower highs within the wedge. It often forms during uptrends and can precede a significant price move to the downside.
📈 Trade Strategy:
Consider short-selling or setting stop-loss levels if the price breaks below the lower trendline of the Rising Wedge.
Set profit targets based on the pattern's height subtracted from the breakdown point.
Implement a stop-loss to manage risk in case of a false breakdown.
Remember to use other technical indicators and conduct thorough research to support your analysis before making any trading decisions. Happy charting and trading! 📉💹
WMT trade ideas
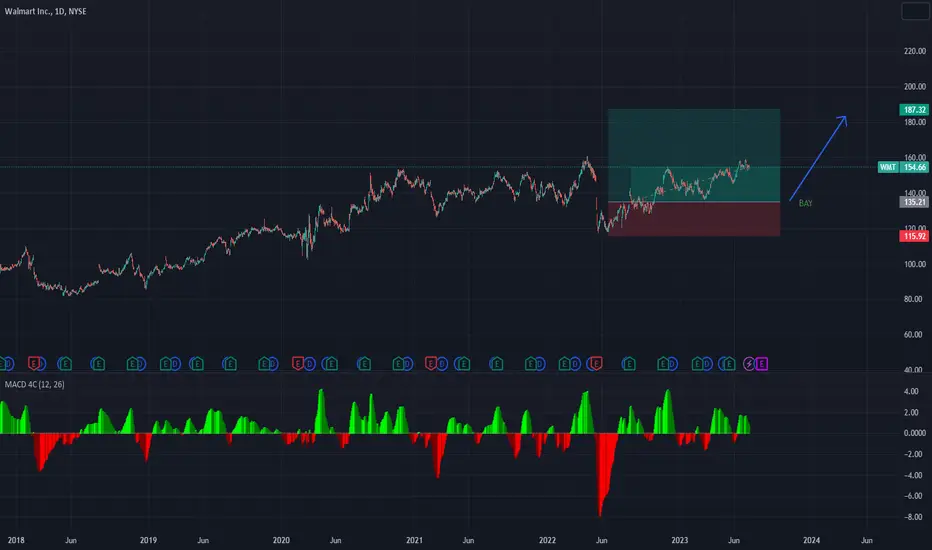
WMTHi ....folks that is clear as acrystal that where is suitable for entering in short position on Walmart share ......170 even number -----178usd .......respect to parallel channels ....!!!1
if you are using my signals please booost my posts.....
Goooooood Luuuuuuck

Walmart soon to drop a bitStarting today I will post a what I think, it's not financial advice just trying to keep track of my trades

Symmetrical TrianglePrice broke up from the rising wedge but fell shortly thereafter.
Possibly the RW corrected with pull back.
No recommendation.


📈📊 #ChartPattern Alert! 📈📊 📈 Rising Wedge 📈📈📊 #ChartPattern Alert! 📈📊
📈 Rising Wedge 📈
📈 What is a Rising Wedge? The Rising Wedge is a bearish chart pattern characterized by two converging trendlines, with the lower trendline sloping upward more than the upper trendline. It typically signals a potential bearish reversal, with the price likely to break downward after the wedge pattern.
📈 How to Identify:
Draw a trendline connecting at least two lower highs (upper trendline).
Draw another trendline connecting at least two lower lows (lower trendline).
📈 What it Signals: The Rising Wedge suggests a potential bearish reversal, with sellers prevailing at lower highs within the wedge. It often forms during uptrends and can precede a significant price move to the downside.
📈 Trade Strategy:
Consider short-selling or setting stop-loss levels if the price breaks below the lower trendline of the Rising Wedge.
Set profit targets based on the pattern's height subtracted from the breakdown point.
Implement a stop-loss to manage risk in case of a false breakdown.
Remember to use other technical indicators and conduct thorough research to support your analysis before making any trading decisions. Happy charting and trading! 📉💹

Walmart - Congratulations. We Now Have "Confirmation."Walmart is another stock that, for some reason, people want to be bullish on. It's probably because Marxist social marketing platform Reddit's public relations firm nestegg r/WallStreetBets said so, or some GPT instance on StockTwits said so.
Yet it's another old company with an old business model that is anything but good. I haven't been to a Walmart in the United States in years, but the ones in Canada aren't even cheap.
They attract people from low social classes and people who moved here from other countries, but are seriously often one of the most expensive options out there and even shopping online are an automatic skip.
Yet people want to get long.
This stock is similar to Target
Target - Why Is Everyone Desperate To Long Disasters?
And Disney
Disney - Is Your Compass Upside Down?
And Paypal
Paypal - Going Long In a Bear Market?
In that none of them are one bit bullish, and yet people are rallied by a certain force into believing that it's time to BUY THEM CALLS because it's GOING TO SQUEEZE or something.
And yet when stuff like Apple or Meta trends upwards for 5-8 straight months you're told to short every pop while it runs away on you.
China's economic problems are seriously escalating and at a frightening speed. The effort is underway to destabilize the Chinese Communist Party, so long as Xi Jinping is its leader and the President of China, at least.
The ultimate endgame is to produce a situation where the CCP and/or Xi falls, but what the International Rules Based Order and its banking cartel want is not to have China's 5,000 years of dynasties and traditions return, but to replace the existing regime with something of a submissive soyregime that's nested out of Taiwan.
And because of this, retail stores are particularly at risk because everyone just loves and loves to put their hands and get their hands in Shanghai where the Jiang Zemin faction is.
When the day comes, the CCP will be gone and the Jiang faction and the CCP's 24-year persecution against Falun Dafa's 100 million spiritual cultivators and all that organ harvesting will become an international story, the only one that matters.
And these companies who have been supplying blood to "China" all these years will really wind up going Blockbuster and delisting.
Walmart's monthly shows us that we have a raid on the '22 all time high. The purpose of these kinds of events is to take out the funds and whales who use stop loss rules.
And if it's really true that Walmart isn't aiming for $180, then it means the next set of rules-based funds and whales to hunt is on the low side, which is a painful $50 away.
On the weekly, this ramp towards the top has been an amusing 52 degrees.
Trendlines are created to be broken because you're told that technical analysis and not price action is somehow important.
The reverse bullish upside down inverse bat pattern harmonic RSI MACD divergence clouds are definitely the way to understand the market, not the places where people are told to put their stops to "mAnAGe ThEiR RiSk."
And so the moons have come together on today's earnings to tell us that it's probably time to sell the rip.
Walmart has produced:
1. A failure swing
2. The rejection came on Q2 earnings as a catalyst/news driver
3. Months and months of insider sales
4. At a time when indexes are toppy
5. Jackson Hole, the biggest Federal Reserve policy meeting of the year, is a week away
6. JP Morgan is long some 15,800 puts with a strike of SPX 4,225 expiring September 29 that have never been in the money since the quarter changed
And so the trade setup is simple.
Don't try to buy the dip. The dip can't be bought.
Instead sell a rip back to the $158 pivot
Buy long duration puts
Sit on your hands and go outside
Take a girl on a date
Listen to music and have wine with her
Tell her that her hair is pretty
Come back a few weeks later and roll them out
Rinse, repeat until $99
Good luck, my friends. It's time to stop listening to the Internet and social media machine. People with low follower counts and low traffic can tell you the truth, but the big dogs are promoted because the purpose is to use you as exit liquidity lol.

Walmart recession by Wyckoff analysisA) Max price with a lower volume than pandemic
B) Break failed, volume decreasing post pandemic
C) Another test to resistance should occur
D) Walmart adjusting to reality
E) Price should break the support with a big volume
F) Final track to the next Support at 80-75

WMT Down After Earnings Beat?Walmart beat earnings but still saw a big drop on Thurs, along with US equities as a whole, but saw some positive gains Friday. With Walmart near the top of its range while US equites have been pulling back, WMT has strong relative strength. If US equities pullback finds a bottom soon, WMT could help lead the way.
Key notes from earnings
Walmart reported a strong quarter with Q3 revenues rising by 5.7% to $161.6 billion, surpassing analyst predictions.
Adjusted earnings stood at $1.84 per share, outperforming expectations of $1.71.
Net income for the fiscal second quarter surged by 53% YoY to $7.89 billion.
Same-store U.S. sales and e-commerce sales grew by 6.4% and 24% respectively.
Walmart anticipates a 4% to 4.5% rise in full-year consolidated net sales.
Share value increased by approximately 12%, marginally outpacing the S&P 500 Index.
Consumer Trends and Economic Factors
Eased price pressures are benefitting U.S. consumers, while challenges like rising fuel costs and high borrowing remain.
Walmart resonates with consumers looking for relief from persistent inflation with its value proposition.
There's a noticeable uptrend in the purchase of grocery staples and "in-home" options as dining out decreases.
Walmart notes broader economic challenges, including surging energy costs and tightened lending, impacting spending behaviors.
US consumers adjust budgets due to obligations like student loan repayments.
Walmart's emphasis on staples and competitive prices makes it resilient against changing consumer preferences and economic factors.
Industry Environment
While Target exceeded profit expectations, it reported its first revenue decline in six years.
Home Depot experienced a dip in sales as consumer focus shifted to smaller home projects.
Innovations like AI software from Afresh Technologies are being utilized by grocers like Albertsons to streamline demand forecasting and reduce food wastage.
Walmart is enhancing its Walmart+ subscription service to stay competitive against Amazon Prime, including slashing prices for government-assisted customers.
Key leadership changes announced include the retirement of CEO Judith McKenna and the introduction of new roles for Kath McLay and Chris Nicholas.
Company Outlook
Boosted by grocery and online growth, Walmart elevated its full-year sales and earnings forecast.
The firm's Q2 results showcased robust earnings and sales growth.
There's a discernible transition in product focus from general merchandise to grocery and health/wellness items.
Improvements in inventory management led to an enhanced gross margin, while operating cash flow and free cash flow witnessed significant increases.

WMT - BEARISH SCENARIOThe retail behemoth's international business posted a 13.3% jump in sales during the second quarter, its strongest result since at least 2016. The unit posted $27.6 billion in sales, or 17% of the company's quarterly revenue, beating market estimates of $26.12 billion.
Despite the better-than-expected results, the price is heading a downtrend to the major support and a price target of $ 146
Risk Disclosure: Trading Foreign Exchange (Forex) and Contracts of Difference (CFD's) carries a high level of risk. By registering and signing up, any client affirms their understanding of their own personal accountability for all transactions performed within their account and recognizes the risks associated with trading on such markets and on such sites. Furthermore, one understands that the company carries zero influence over transactions, markets, and trading signals, therefore, cannot be held liable nor guarantee any profits or losses.

Walmart reports bumper earnings, but prices heads lowerWalmart has managed to beat expectations across the board today, with the retailer clearly managing to fare well despite concerns over the potential for an economic slowdown. Compared with Bloomberg numbers, the company has managed to outperform across a host of metrics:
Net revenue: $161.6 billion versus $159.7 billion expected
Adjusted diluted EPS: $1.84 versus $1.70 expected
US same-store sales growth: 6.3% versus 4.04% expected
Sam's Club US stores growth: 5.5% versus $5.58 expected
Walmart US same-store sales growth: 6.40% versus 4.29% expected
Traffic growth: 2.90% versus 1.63% expected
Ticket growth: 3.40% versus 2.00% expected
E-commerce growth: 2.30% versus 1.54% expected
Gross margin: 23.38% versus 23.55% expected
Inventory growth: -5.34% versus -5.54% expected
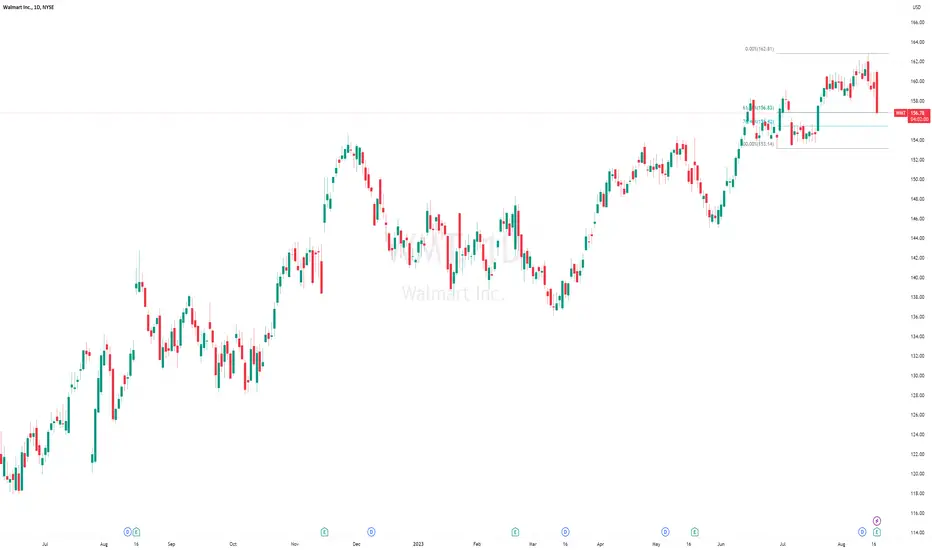
However, this has done little to help the stock, with price falling back in early trade. Nonetheless, the bullish trend seen over the course of the past two-years does bring confidence that the bulls are going to come back into the fold once again here. As such, watch for a potential bullish reversal for Walmart, with a decline through $153.14 support required to negate that bullish trend.
Plan Walmart Earning 17/08/20231. Walmart set to raise its full-year forecast as shoppers stick to essentials
2. Walmart is set to raise its full-year earnings forecast on Thursday when it reports quarterly results, as U.S. shoppers continue to buy essentials even as borrowing costs rise, lending standards tighten and the employment picture weakens.
3. Walmart is in a sweet spot among retailers as broader economic stresses push more people to shop for essentials such as groceries, its core business. Selling toilet paper, beans, pasta and toothpaste brings people into its stores, giving Walmart opportunities to cross sell more profitable merchandise including pens, notepads and backpacks.
4. Walmart, which is known for its low prices, drew in shoppers earning more than $100,000 a year during peak inflation in 2022.
Walmart CEO Doug McMillon in May cautioned that stubborn inflation, especially in food, was "one of the key factors creating uncertainty for us in the back half of the year."
5. Walmart in May forecast net sales would rise about 3.5% this fiscal year, up from its prior outlook in February of a 2.5% to 3% rise, in part due to higher prices. It also raised its earnings forecast.
6. Walmart trades at 24.2 times 12-month forward earnings compared to 14.9 times for Target and 19.9 times for the S&P 500 Consumer Staples index, according to Refinitiv DataStream. Simpson characterized Walmart's current multiple as "high."

$WMT Outperforms $SPY and $XLP: A Weekly Comparative AnalysisDetails:
Walmart ( NYSE:WMT ): Over the weekly time frame, Walmart saw an impressive gain of 22.51%, highlighting a strong trend in its stock performance.
S&P 500 ( AMEX:SPY ) : This ETF tracks the S&P 500 Index, a benchmark for 500 of the largest companies in the U.S. stock market. During the same period, AMEX:SPY recorded a gain of 16.17%.
Consumer Staples ( AMEX:XLP ): AMEX:XLP represents the Consumer Staples sector of the S&P 500, focusing on necessities like food, beverages, and household goods. It rose 15.61% in the weekly time frame.
Comparative Analysis:
NYSE:WMT vs. AMEX:SPY : Walmart outperformed the broader market ( AMEX:SPY ) by 6.34%.
NYSE:WMT vs. AMEX:XLP : Walmart's growth outshines the Consumer Staples sector ( AMEX:XLP ) by 6.90%.
Technical Indicators:
50-Day Exponential Moving Average (EMA): At present, NYSE:WMT is trading above its 50-day EMA, located around the $156.00 price mark. This divergence from the mean value might point to an overextension, particularly since the stock has reached all-time highs for the past five consecutive days.
Bollinger Bands & RSI: Walmart's stock is brushing against the upper Bollinger Band, hinting at possible overbought conditions. This is further corroborated by an RSI nearing 70, signaling that a pullback might be on the horizon.
Conclusion:
The combination of strong weekly gains and the current technical indicators presents a complex picture for $WMT. While the stock's performance has been robust, some signs point to potential overextension. Investors and traders must weigh these factors carefully and consider their strategies accordingly. The data and analysis presented here serve as valuable tools for understanding the stock's dynamics and planning future moves.

August Trades (WMT, account up 0%)5th day trade in August is NYSE:WMT on 8/9/2023.
Account is up 0%.
Total return is August is 15.17%.

Wallmart long signal incomingWallmart had a really hard time to beat its all time high. And even when the price rose above the All Time High, it was immediately sold off again.
But now it could be the time for a big breakout of this hard resistance zone. The trend started soft and takes on a healthy strength.
If the price manages to break through the resistance zone, a long-term uptrend could be possible!

#WMT Straddle/Trade planStraddlle detected up to 15-Sep.
Based on our team's research of the options market, we expect buy activity at the support level or sell activity at the resistance.
We primarily consider levels to be activity zones, but not to be a super-fine level for establishing a limit order. Use them in com

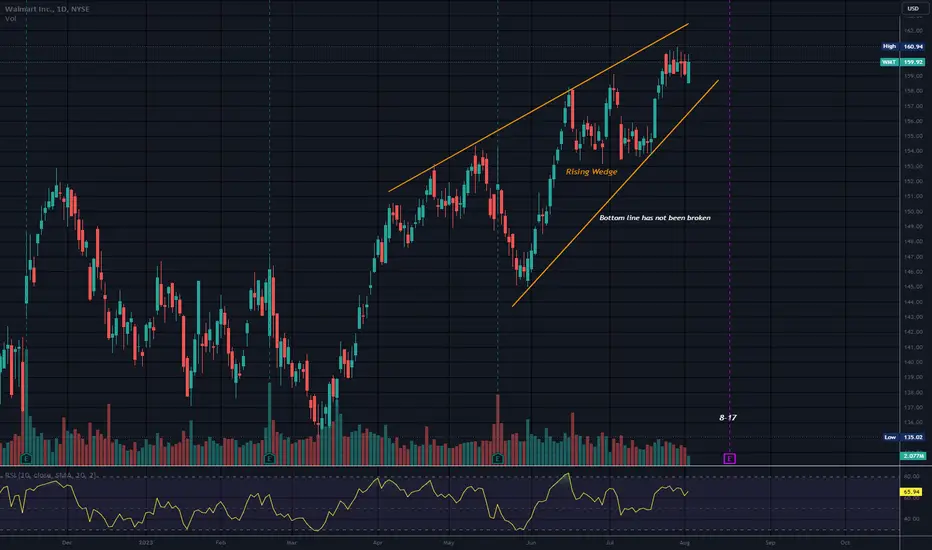
Rising WedgeEarnings 8-17 BMO.
Price is traveling in a Rising Wedge that is not valid until the bottom line is broken and it has not been broken as of yet.
I have noted that rising wedges which are bearish in the end, can be especially ominous at earnings.
It is possible for price to break up from a rising wedge and as the 2 upsloping lines converge at the apex, price can get squeezed to the upside. More often price is squeezed to the downside at the apex.
Price can stay above a Rising Wedge or inside a RW for a long time. Many oil stocks have been over rising wedges for over a year.
The issue with this phenomena is that when price comes down and hits the RWs beneath price, there is a large sell off due to the oversupply within the wedge.
No recommendation.
William Arthur Ward
“The pessimist complains about the wind; the optimist expects it to change; the realist adjusts the sails.”
WMT 2H 2023, 3d chartWMT forming a big wedge leading up to earnings. Publishing to keep an eye on it.

Flag high and tight Bullish continuation pattern
Look to ride the wave up
Flag high and tight pattern
Expecting good news from Walmart cooperation in next 2 weeks
Long opportunity


Walmart in a bullish channel.Walmart - 30d expiry - We look to Buy at 154.33 (stop at 150.33)
Price action continues to trade around the all-time highs.
Trading within a Bullish Channel formation.
We look to buy dips.
The primary trend remains bullish.
Trend line support is located at 154.
This stock has seen good sales growth.
Our profit targets will be 164.33 and 166.33
Resistance: 159.50 / 161.00 / 163.00
Support: 157.50 / 155.00 / 154.00
Please be advised that the information presented on TradingView is provided to Vantage (‘Vantage Global Limited’, ‘we’) by a third-party provider (‘Everest Fortune Group’). Please be reminded that you are solely responsible for the trading decisions on your account. There is a very high degree of risk involved in trading. Any information and/or content is intended entirely for research, educational and informational purposes only and does not constitute investment or consultation advice or investment strategy. The information is not tailored to the investment needs of any specific person and therefore does not involve a consideration of any of the investment objectives, financial situation or needs of any viewer that may receive it. Kindly also note that past performance is not a reliable indicator of future results. Actual results may differ materially from those anticipated in forward-looking or past performance statements. We assume no liability as to the accuracy or completeness of any of the information and/or content provided herein and the Company cannot be held responsible for any omission, mistake nor for any loss or damage including without limitation to any loss of profit which may arise from reliance on any information supplied by Everest Fortune Group.

WMT - Long term wave countIn the weekly chart, I see the long uptrend run in its final stages.
My final target is the 163.27 to 174.55 range, corresponding to the 100% to 161.8% ABC extension.

Digital and technical analysisWe see that there is an increase in the buying momentum and we are in a correction