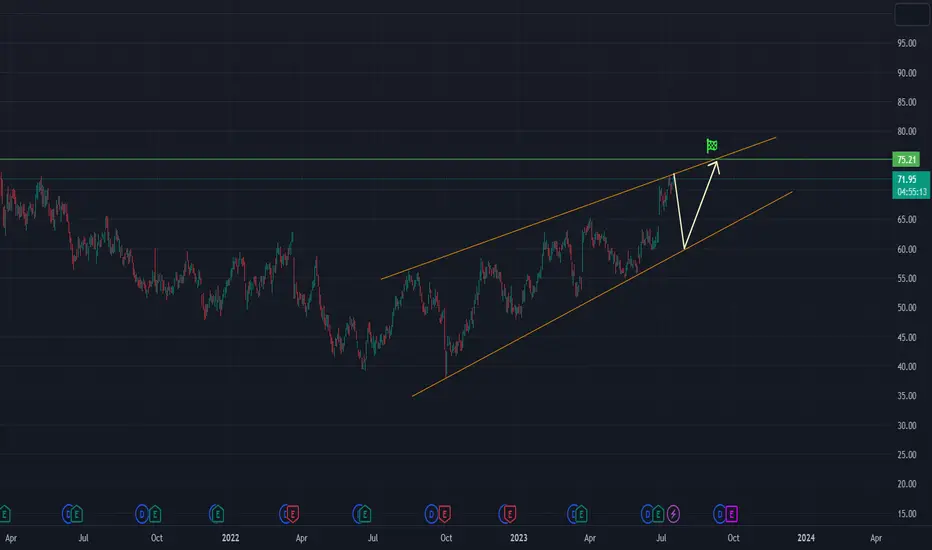
WOR the price inside the wedge As we can see on the chart WOR has been uptrending and currently the price is respecting the upsloping support.
We expect the price continue to be in an uptrend, so our strategy is entering a long position close to the upsloping support.
Target would be at the upsloping resistance (upper boundary of the rising wedge)
WTH trade ideas
WOR - Angled W PatternA W Pattern that has yet to experience the bullish phase. (1) Angled slightly to the left. Weekly timeframe. Using the bars pattern to plot the next move of the W.

WOR Long opportunity soonEarning call made the sell volume high at the end of trading hour, price will further south. Tmr we will see a big gap to fill.

ConfluenceReverse head and shoulders, symmetrical triangle which is also being capped by the supply zone with upper limits around 47.3. Once the supply is cleared, it can easily go back to around 50.
How to trade it:
1- Going long upon confirmation which could only be profitable if you can reasonable commission.
2- Call debit spread 45/50 with max profit of $323 and max risk of 176


XME Components Analysis Number 12: WOR (Worthington Industries)I have recently published a series of bullish articles about-XME.
WOR-is one of the components of-XME. The strength of this chart speaks for itself -
It is one of the metals stocks which is contributing to the strength in-XME.
XME-is the-SPDR S&P-Metals and Mining ETF-which offers broad exposure to industrial-and precious metals and mining, with a strong emphasis at the lower end of the capitalization spectrum. It holds 25 components in an equal weighted market cap.
I believe by showing you some of the individual components of-XME you will understand why I am very bullish towards the upward move in-XME.
Don.

Looking at the short side. Any fundamental analyst's?WOR is America's largest independent processor of flat-rolled steel. The company takes steel from steel producers and processes it for customers in a variety of industries including automotive, lawn and garden, construction, hardware, office furniture, electrical control, leisure and recreation, appliance, agriculture and HVAC. Im not a fundamentalist so im unsure of why there business may be set to struggle but im looking at the short side from a tech analyst side only. If anyone can add a fundamental theory please post.
There's a case for a double top. Quite often you see the small bounce off the neckline before a break.
I like how price has failed or is beaten away from attempts of pushing through 50ma which is also under the 50% fib retracement of the C to D leg.
From point D to the recent lower high I have drawn a projected 161.8 move which is shown as the trade. stop at around 39.8 offers good risk reward and if price was to move up to that point the chart would start to look bullish.
I always like to look at the other side of the trade also. looking from a bullish scenario a move above the 50ma would project to be between 42.5 and 45.


