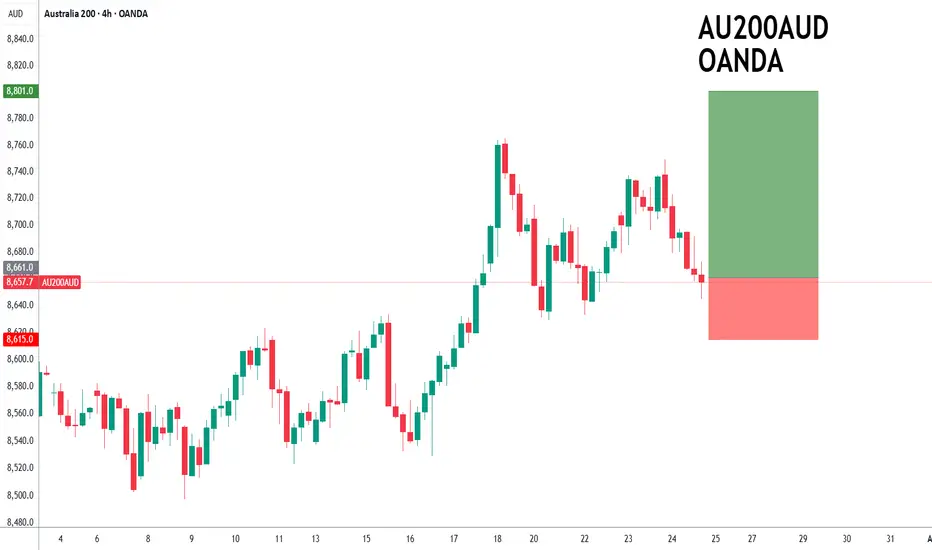
ASX200 to find buyers at current market price?ASX200 - 24h expiry
Price action resulted in a new all-time high at 8765.
Price action continues to trade around the all-time highs.
The bullish engulfing candle on the 4 hour chart the positive for sentiment.
50 4hour EMA is at 8658.
We look for a temporary move lower.
We look to Buy at 8661
About S&P/ASX Index
The S&P/ASX 200 index (also known as the XJO) is the main benchmark for the Australian equity market (replacing the venerable All Ords as the industry standard). The index is made up of 200 of the top stocks, which boast a total value of around $1.1 billion (end of March 2010).
Australia 200: Pullback Presents Second Chance for LongsThe Australia 200 contract continues to trade above former horizontal resistance at 8627, with Monday’s pullback offering an improved entry level for longs looking to buy the breakout.
Bullish positions could be established ahead of 8627, with a stop beneath for protection. The session high of 8727

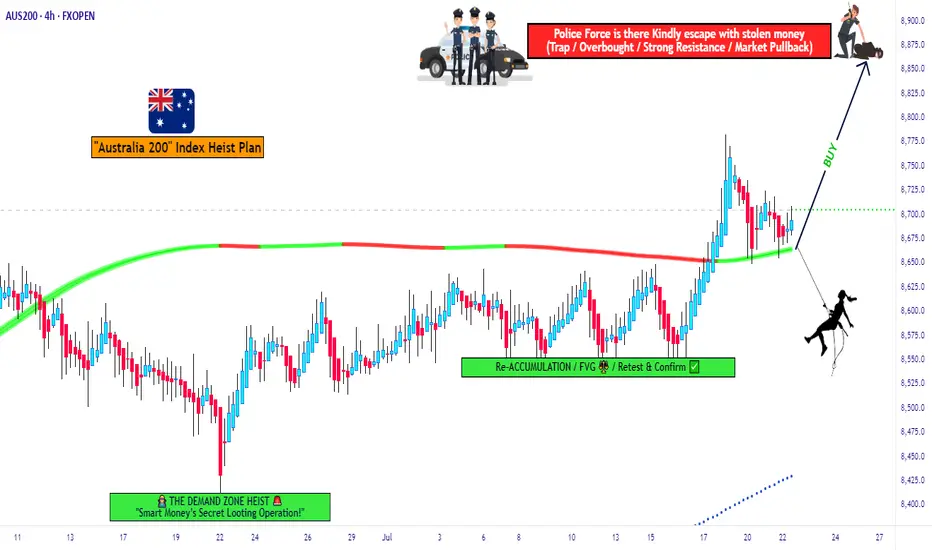
ASX200 Heist Blueprint – Entry, Exit, Escape Mapped Out!💼💣 The ASX200 Heist Blueprint: Bullish Loot Incoming! 🔥💰
🌍 Hi! Hola! Ola! Bonjour! Hallo! Marhaba! 👋
Welcome back, Money Makers & Market Robbers! 🤑💸✈️
It's time for another high-stakes heist, this time targeting the ASX200 / AUS200 “Australia 200” Index. Get your trading toolkit ready – we're plann
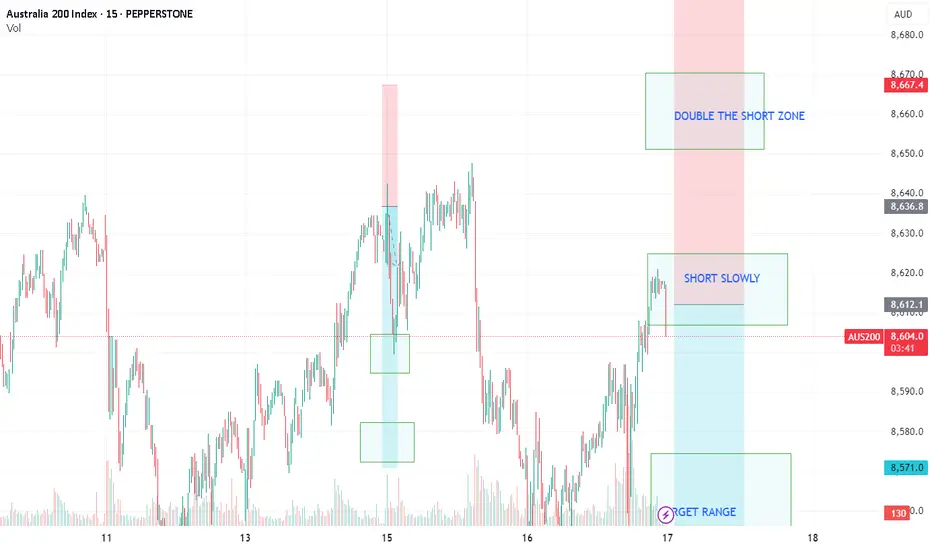
AUS200/ASX200 - ANOTHER DAY TO MAKE THEM PAYTeam, we have successfully SHORT AUS200 last week and kill them with our ACTIVE TRADER COMMUNITY.
Time to have another short at this current price level 8609-8626 ranges
DO NOT FEAR - DOUBLE THE SHORT AT 8642-56 - KILL them
Our first target range at 8586-72 - take 60% profit and bring stop loss to
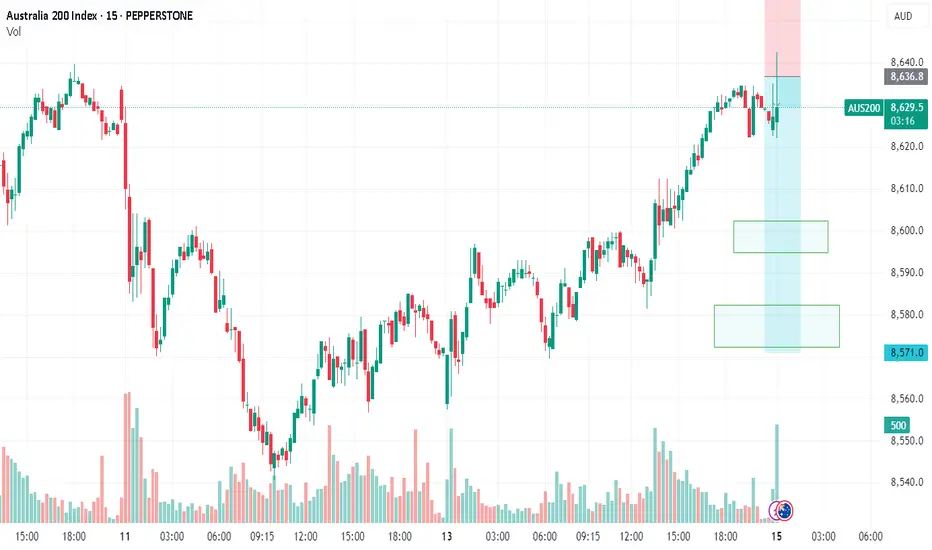
AUS200/ASX200 - OPPORTUNITY KNOCKING OUR DOORTeam, time to SHORT the hell out of AUS200 at 8632 to 8645 ranges
Taking 50-60% target at 8606-8592
ensure bring stop loss to BE once it hit our first target
then second target at 8585-8572
LET'S GO AND KILL THEM.
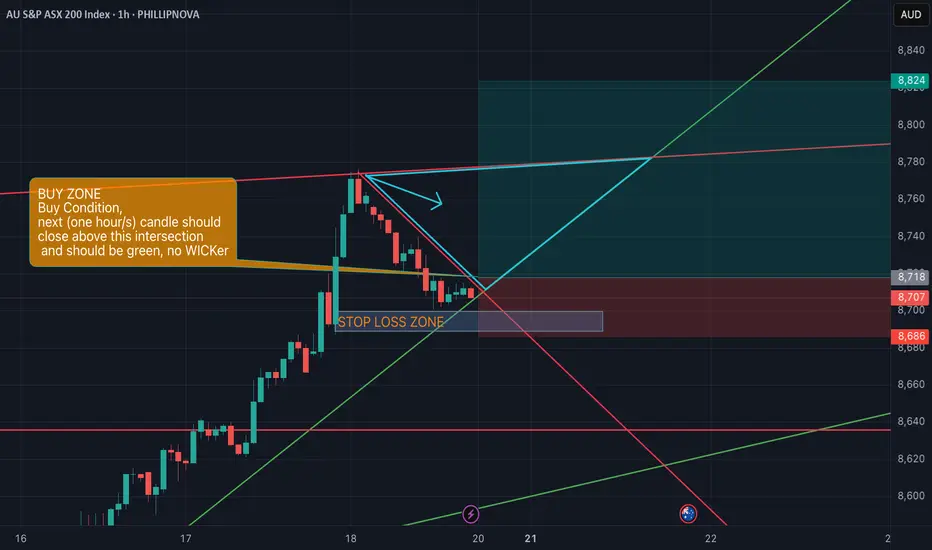
AUS200 Breakout or Fakeout? I Say Breakout – Here's Why🔍 Technical Overview:
After monitoring the recent movement in AUS200, I believe we are in the early phase of a bullish breakout continuation rather than a fakeout.
Uptrend Structure: Price has been consistently respecting higher lows and trending above the green trendline.
Break of Descending Resi
ASX200- Swing Trade Plan - SELLThe ASX200 has reached last year's high, and bulls have attempted to push the price higher, and we have seen a failure for demand on the weekly for the last two weekly candles.
Seasonality - Risk off.
Price is reached MM3 pivot.
If support is breached on the hourly -8592 and the hourly candle closes

AUS200/ASX200 - LETS MAKE MILLIONYesterday, we hope you all enjoyed SHORT UK100 AND AUS200, we did it twice in our channel
Today we are reshorting AUS200 at 8600-8226 ranges
Target at 8572-8561
Yesterday, while doing REAL LIVE TRADING every day, we killed the NAS AND DOW on a long trade.
Bring us 6 out of 6 trades successful fo

SHORT AUS200/ASX200 - TIME TO SHORT THE AUSSIETeam, over the last few days, we have been successfully SHORT BOTH UK100/AUS200, but I did not post the chart
Today is a good time to post.
Ensure you understand your RISK - can always discuss with us in the room
Let's SHORT UK100/FTSE100, I still expect the market to be volatile even though the U

AUS200/ASX200 - MASTERMIND FOR SUCCESS STRATEGY Team, last night we did another successful trade on DOW/US30 AND NAS30
If you have time, watch my video how i made 1.5k turn into 20k per month and expect 6 months to hit 100k
so far 2 and half month reached 80k
We are shorting slowly at 8572-8586 range
With target at 8545-36
Now, this is another

See all ideas
Displays a symbol's price movements over previous years to identify recurring trends.
Frequently Asked Questions
S&P/ASX Index reached its highest quote on Jul 18, 2025 — 8,787.11 AUD. See more data on the S&P/ASX Index chart.
The lowest ever quote of S&P/ASX Index is 1,358.50 AUD. It was reached on Nov 17, 1992. See more data on the S&P/ASX Index chart.
S&P/ASX Index is just a number that lets you track performance of the instruments comprising the index, so you can't invest in it directly. But you can buy S&P/ASX Index futures or funds or invest in its components.