US Big Tech (FAANG) Quote | Chart & Forecast SummaryKey Indicators On Trade Set Up In General
1. Push Set Up
2. Range Set up
3. Break & Retest Set Up
Notes On Session
US Big Tech (FAANG) Quote
- Double Formation
* (Open Trade)) | Completed Survey | Inverted Pattern Confirmation
* ABC Flat | Continuation Area | Subdivision 1
- Triple Formation
* Numbered Retracement | Uptrend Bias & Entry Settings | Subdivision 2
* Trendline 1, 2 & 3 | Support & Resistance | Subdivision 3
* Daily Time Frame | Trend Settings Condition
Active Sessions On Relevant Range & Elemented Probabilities;
European Session(Upwards) - US-Session(Downwards) - Asian Session(Ranging)
Conclusion | Trade Plan Execution & Risk Management On Demand;
Overall Consensus | Buy
FAANG trade ideas

🐲 The Roaring FAANG. Five Big Tech Stocks That Move The MarketFAANG is an acronym that stands for five major, highly successful U.S. tech companies: Meta (formerly Facebook), Amazon, Apple, Netflix, and Google.
FAANG stocks' performance has a substantial effect on the overall market and comprises 15% of the S&P500 Index SP:SPX .
If you follow the financial or business news, you may have seen or heard the term FAANG thrown around. No, it's not a misspelling or an animal's roar. It's an acronym that stands for five big companies — some might say the big companies — in the high-tech industry.
The FAANG quintet consists of Meta (formerly Facebook), Amazon , Apple, Netflix and Google (Alphabet as an official corporate name).
These corporations — all American, but with a global presence — are not only household names, they're financial behemoths. Their combined market capitalization is over $4 trillion. The blue-chip stocks of the tech sector, they collectively make up 15% of the Standard & Poor's 500 SP:SPX (an index of the largest public companies in the US). So they represent not only one of the US' most significant industries, but a sizable chunk of the US stock market itself.
The origins of FAANG
FAANG actually began as FANG. The origin of the acronym has been attributed to Jim Cramer, the financial TV host and co-founder of TheStreet.com. Known for his slangy abbreviations and catchy phrases, Cramer coined the term in 2013 to represent four tech stocks with outsized market appreciation. Cramer believed that these companies belonged together because they are all high-growth stocks that share the common threads of digitization and the web.
Cramer's original term was just FANG — it didn't initially include Apple. The company joined the ranks in 2017, reflecting the growth of internet services (iCloud, Apple Music, Apple Pay) to its revenues.
So the acronym became FAANG, and it's remained so.
The five stocks of FAANG
They need no introduction: The five stocks of FAANG are all familiar brands, whose products and services permeate our lives daily. They are also American corporate success stories — each has seen its stock shares experience triple-digit growth since 2015, and year-to-year as well.
👉 Meta ( NASDAQ:META ) is the social media maestro, owner of Instagram, WhatsApp, and its Facebook website. It has returned more than 190% over the past 12 months, and it is a # 1 over all S&P500 Index components with that amazing result.
👉 Apple ( NASDAQ:AAPL ), the sole product manufacturer of the group, with more than 36% yearly performance.
👉 Amazon ( NASDAQ:AMZN ), the world's largest e-store, has returned more than 65% over the past 12 months.
👉 Netflix ( NASDAQ:NFLX ), the superpower of streaming, has returned 44% TTM.
👉 Google — parent company Alphabet ( NASDAQ:GOOG , NASDAQ:GOOGL ) — has a name synonymous with internet searches and services. Its GOOG shares have increased by more than 43% in 12 months.
Just to put these numbers in context: the S&P 500 has grown 17% over the past 12 months. So FAANG stocks have been at the forefront , significantly outperforming the broad market.
Twelve months performance of FX:FAANG components vs S&P500 Index
The bottom line
The main technical graph (3-day chart for FX:FAANG stock basket, introduced by @FXCM provider, with 20% inception weight for every single component) illustrates perhaps right there happens the major breakout of 52-week highs, with further projected/ targeted upside price action.

FAANG's Bullish Banner:FAANG's Falling Flag Sets for 5780FAANG's Bullish Banner:FAANG's Falling Flag Sets for 5780
1.Price Formation: The price has broken out from a FALLING FLAG price formation on a daily chart.
2.Moving Averages: The 7-day moving average (MA) is above the 21-day MA, which is a positive sign indicating bullish momentum.
3.200-day Moving Average is below the Price.
4.Thus, Mas 7>21>200
5.Relative Strength Index (RSI): The RSI is > than 50, indicating bullish momentum and potential further upward movement.
6.Price Target: 5780

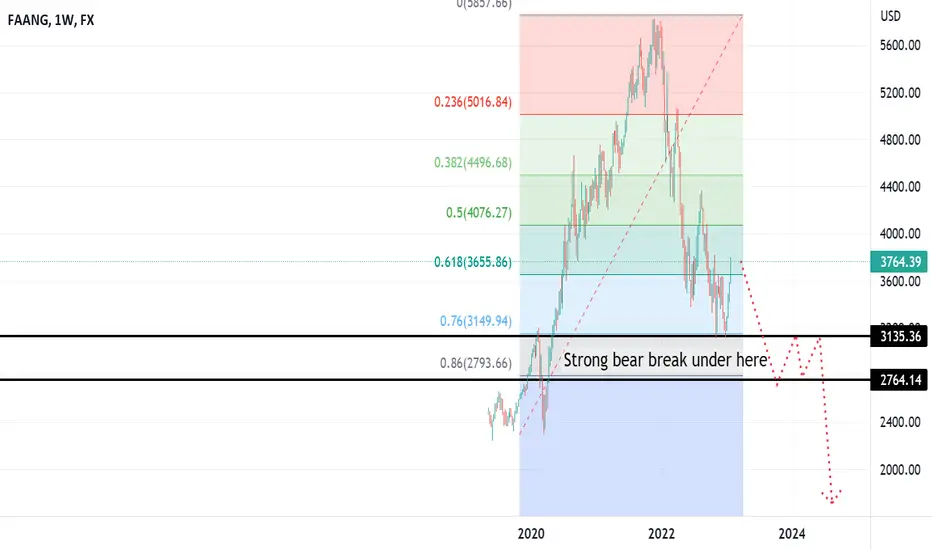
FAANG low may be confirmed now. FAANG made a big 76 low. When this happened, this became a critical break level for FAANG - however, it did not break. Instead it rallied and then held the 61. This may have been signs of the end of the downtrend in FAANG, for now at least.
Still unsure if this would be more likely to be a new high of just a 76 retracement of the drop/double top style move. But I have a strong long bias while above the 61.

If FAANG makes a new low uptrend has failed.As per the classic rules of a trend holding 76 retracements, if FAANG were to break again we'd have a failure of the FANNG uptrend. FANNG would have crossed the level where a correction becomes a reversal.
Very critical level.
Low could be in, from a more optimistic stance. 76s are common levels for lows. However, I think we probably should have made a low and been higher on the first drop to 76. This has more of a bull trap feel to it at the moment.
FAANG Is about to go higher!Traders and Investors, FAANG index has reached an FCP zone which is also a previous structure level. This can create a good bounce up (BULL) opportunity for all FAANG stocks.
Facebook (Meta)
Apple
Amazon
Netflix
Google
Please support this analysis by liking and sharing. 👍🙂
Rules:
1. Never trade too much
2. Never trade without a confirmation
3. Never rely on signals, do your own analysis and research too
✅ If you found this idea useful, hit the like button, subscribe and share it in other trading forums.
✅ Follow me for future ideas, trade set ups and the updates of this analysis
✅ Don't hesitate to share your ideas, comments, opinions and questions.
Take care and trade well
-Vik
____________________________________________________
📌 DISCLAIMER
The content on this analysis is subject to change at any time without notice, and is provided for the sole purpose of education only.
Not a financial advice or signal. Please make your own independent investment decisions.
____________________________________________________

FAANG Index 2H 2022Publishing a follow up to the FAANG index. Expecting it to continue having a few traps on its way to the 3100-3200 range
Unfortunately, the previous idea tracking a collection of FAANG + other major stocks was ruined due to stock splits and what not, but general idea remains the same.
Until the fed reigns in the reverse repo operations, that's > $2 trillion taken out of the economy earning an absurd risk free yield from the fed. No liquidity = risk-off.
As always, keep an eye on the king USD.

Falling Wedge + Bullish RSI convergence on FAANGAlthough I biased bearish for the past year, the markets are clearly oversold and, furthermore, appear to be showing consolidative pattersn.
FAANG index is also showing bullish consolidation.
We have a falling wedge and a strong bullish RSI convergence.
I believe the recent downturn was also an ABC move.
So, in short, although we are down a lot, we have a very bullish outline despite the bearish macro-narrative.


FAANG STOCKS INDEX ABOUT TO BOUNCE FROM IMPORTANT SUPPORT LEVELSQQQ and NDX bouncing with help of FAANG stocks. Only to fail again.
Regression Channel with bands of +3/-3 standard deviations on daily FAANG chart spanning the entire uptrend from the pandemic lows,
The chart illustrates a Normal Distri SPARKS:FAANG bution of prices with 95% or more of the price occurrences happening - as they should - within the Comfort Zone, which is the blue area bounded between +2/-2 standard deviations.
The FAANG stock index is very close to touching the lower edge of the -3 standard deviation band, which coincides with important horizontal support levels. An important rebound is expected in this area. This bounce will help QQQ and NDX to have a relief.
Downward pressure will continue. The bounce will probably have rejection at the lower edge of the Comfort Zone and fail to enter it. If that is the case and it remains an extended time out of it, a medium-term trend change would be materializing.
If it manages to re-enter the Comfort Zone a major rejection should occur at the Regression Line which is the center line of the Channel.
SPARKS:FAANG

FAANG potential for bounce | 7th MarchPrice is near buy entry price of 4513.89 in line with 50% Fibonacci retracement . Price can potentially bounce from this level to the take profit level of 4868.38 in line with 50% Fibonacci retracement and 78.6% Fibonacci projection . Our bullish bias is supported by technical indicator.
Any opinions, news, research, analyses, prices, other information, or links to third-party sites contained on this website are provided on an "as-is" basis, as general market commentary, and do not constitute investment advice. The market commentary has not been prepared in accordance with legal requirements designed to promote the independence of investment research, and it is therefore not subject to any prohibition on dealing ahead of dissemination. Although this commentary is not produced by an independent source, FXCM takes all sufficient steps to eliminate or prevent any conflicts of interest arising out of the production and dissemination of this communication. The employees of FXCM commit to acting in the clients' best interests and represent their views without misleading, deceiving, or otherwise impairing the clients' ability to make informed investment decisions. For more information about the FXCM's internal organizational and administrative arrangements for the prevention of conflicts, please refer to the Firms' Managing Conflicts Policy. Please ensure that you read and understand our Full Disclaimer and Liability provision concerning the foregoing Information, which can be accessed on the website.

FAANG potential for bounce | 7th MarchPrice is near buy entry price of 4513.89 in line with 50% Fibonacci retracement. Price can potentially bounce from this level to the take profit level of 4868.38 in line with 50% Fibonacci retracement and 78.6% Fibonacci projection. Our bullish bias is supported by technical indicator.
Any opinions, news, research, analyses, prices, other information, or links to third-party sites contained on this website are provided on an "as-is" basis, as general market commentary, and do not constitute investment advice. The market commentary has not been prepared in accordance with legal requirements designed to promote the independence of investment research, and it is therefore not subject to any prohibition on dealing ahead of dissemination. Although this commentary is not produced by an independent source, FXCM takes all sufficient steps to eliminate or prevent any conflicts of interest arising out of the production and dissemination of this communication. The employees of FXCM commit to acting in the clients' best interests and represent their views without misleading, deceiving, or otherwise impairing the clients' ability to make informed investment decisions. For more information about the FXCM's internal organizational and administrative arrangements for the prevention of conflicts, please refer to the Firms' Managing Conflicts Policy. Please ensure that you read and understand our Full Disclaimer and Liability provision concerning the foregoing Information, which can be accessed on the website.

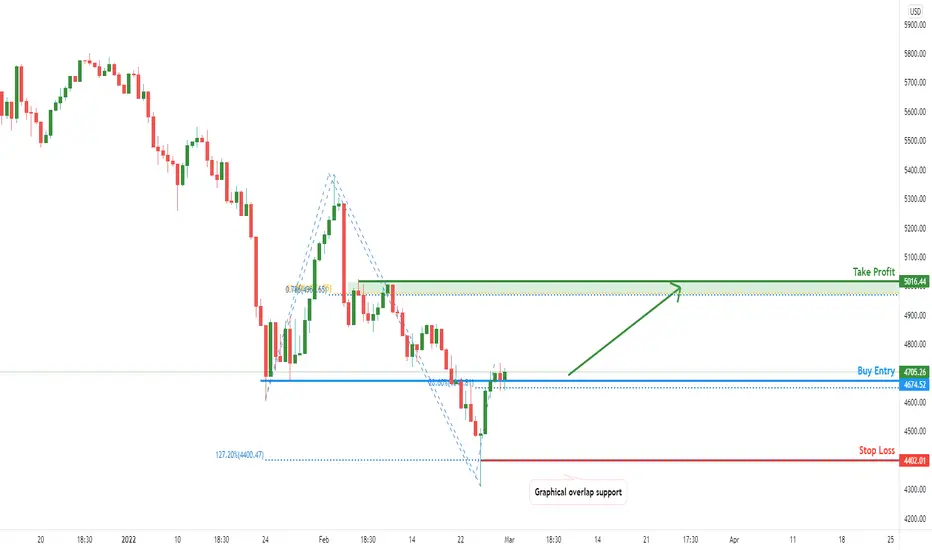
FAANG potential for bullish bounce | 4th MarchPrice is near buy entry level of 4619.72 in line with 38.2% Fibonacci retracement. Price can potentially bounce to the take profit level of 5012.95 in line with 61.8% Fibonacci retracement. Our bullish bias is supported by technical indicators.
Any opinions, news, research, analyses, prices, other information, or links to third-party sites contained on this website are provided on an "as-is" basis, as general market commentary, and do not constitute investment advice. The market commentary has not been prepared in accordance with legal requirements designed to promote the independence of investment research, and it is therefore not subject to any prohibition on dealing ahead of dissemination. Although this commentary is not produced by an independent source, FXCM takes all sufficient steps to eliminate or prevent any conflicts of interest arising out of the production and dissemination of this communication. The employees of FXCM commit to acting in the clients' best interests and represent their views without misleading, deceiving, or otherwise impairing the clients' ability to make informed investment decisions. For more information about the FXCM's internal organizational and administrative arrangements for the prevention of conflicts, please refer to the Firms' Managing Conflicts Policy. Please ensure that you read and understand our Full Disclaimer and Liability provision concerning the foregoing Information, which can be accessed on the website.

FAANG potential for bullish continuation | 3rd MarchPrice is trading in a descending channel and near buy entry level of 4609.60 in line with 38.2% Fibonacci retracement . Price can potentially go to the take profit level of 5005.16 in line with 78.6% Fibonacci projection and 61.8% Fibonacci retracement . Our bullish bias is supported by technical indicators.
Any opinions, news, research, analyses, prices, other information, or links to third-party sites contained on this website are provided on an "as-is" basis, as general market commentary, and do not constitute investment advice. The market commentary has not been prepared in accordance with legal requirements designed to promote the independence of investment research, and it is therefore not subject to any prohibition on dealing ahead of dissemination. Although this commentary is not produced by an independent source, FXCM takes all sufficient steps to eliminate or prevent any conflicts of interest arising out of the production and dissemination of this communication. The employees of FXCM commit to acting in the clients' best interests and represent their views without misleading, deceiving, or otherwise impairing the clients' ability to make informed investment decisions. For more information about the FXCM's internal organizational and administrative arrangements for the prevention of conflicts, please refer to the Firms' Managing Conflicts Policy. Please ensure that you read and understand our Full Disclaimer and Liability provision concerning the foregoing Information, which can be accessed on the website.

FAANG potential for bullish continuation | 3rd MarchPrice is trading in a descending channel and near buy entry level of 4609.60 in line with 38.2% Fibonacci retracement. Price can potentially go to the take profit level of 5005.16 in line with 78.6% Fibonacci projection and 61.8% Fibonacci retracement. Our bullish bias is supported by technical indicators.
Any opinions, news, research, analyses, prices, other information, or links to third-party sites contained on this website are provided on an "as-is" basis, as general market commentary, and do not constitute investment advice. The market commentary has not been prepared in accordance with legal requirements designed to promote the independence of investment research, and it is therefore not subject to any prohibition on dealing ahead of dissemination. Although this commentary is not produced by an independent source, FXCM takes all sufficient steps to eliminate or prevent any conflicts of interest arising out of the production and dissemination of this communication. The employees of FXCM commit to acting in the clients' best interests and represent their views without misleading, deceiving, or otherwise impairing the clients' ability to make informed investment decisions. For more information about the FXCM's internal organizational and administrative arrangements for the prevention of conflicts, please refer to the Firms' Managing Conflicts Policy. Please ensure that you read and understand our Full Disclaimer and Liability provision concerning the foregoing Information, which can be accessed on the website.

FAANG potential for bullish bounce | 2nd MarchPrice is near buy entry level of 4734.49 in line with 38.2% Fibonacci retracement. Price can potentially go to the take profit level of 5008.63 in line with 61.8% Fibonacci retracement and 78.6% Fibonacci projection. Our bullish bias is supported by technical indicators.
Any opinions, news, research, analyses, prices, other information, or links to third-party sites contained on this website are provided on an "as-is" basis, as general market commentary, and do not constitute investment advice. The market commentary has not been prepared in accordance with legal requirements designed to promote the independence of investment research, and it is therefore not subject to any prohibition on dealing ahead of dissemination. Although this commentary is not produced by an independent source, FXCM takes all sufficient steps to eliminate or prevent any conflicts of interest arising out of the production and dissemination of this communication. The employees of FXCM commit to acting in the clients' best interests and represent their views without misleading, deceiving, or otherwise impairing the clients' ability to make informed investment decisions. For more information about the FXCM's internal organizational and administrative arrangements for the prevention of conflicts, please refer to the Firms' Managing Conflicts Policy. Please ensure that you read and understand our Full Disclaimer and Liability provision concerning the foregoing Information, which can be accessed on the website

FAANG potential for bullish continuation | 1st March Price is near buy entry level of 4674.52 in line with 23.6% Fibonacci retracement. Price can potentially go to the take profit level of 5016.44 in line with 78.6% Fibonacci projection and 61.8% Fibonacci retracement. Our bullish bias is supported by technical indicators.
Any opinions, news, research, analyses, prices, other information, or links to third-party sites contained on this website are provided on an "as-is" basis, as general market commentary, and do not constitute investment advice. The market commentary has not been prepared in accordance with legal requirements designed to promote the independence of investment research, and it is therefore not subject to any prohibition on dealing ahead of dissemination. Although this commentary is not produced by an independent source, FXCM takes all sufficient steps to eliminate or prevent any conflicts of interest arising out of the production and dissemination of this communication. The employees of FXCM commit to acting in the clients' best interests and represent their views without misleading, deceiving, or otherwise impairing the clients' ability to make informed investment decisions. For more information about the FXCM's internal organizational and administrative arrangements for the prevention of conflicts, please refer to the Firms' Managing Conflicts Policy. Please ensure that you read and understand our Full Disclaimer and Liability provision concerning the foregoing Information, which can be accessed on the website.
FXCM FAANG Basket Moves Into Bullish Stack On the DailyThe above chart show's the daily time frame of FXCM's FAANG Basket. We are using a triple EMA system to assess trend. The short-term green EMA > intermediate orange EMA and the intermediate orange EMA> the slow red EMA (blue rectangle). We note that NFLX reported last week and that the rest of the FAANGs (FB, AAPL, AMZN, GOOG) will report this week. Following their respective releases we will assess the basket's EMAs and their angle and separation. If these develop, it will be regarded as bullish, suggesting that a possible bullish momentum push may be underway.

MSFT short at supplyThe analysis are pre described from supply and demand zones plus Liquidity as we know that no zone is simply breaked we need liquidity to break the zones. short sentiments are expected at the previous supply zone. this will come as a result of asserts such as nasdaq retesting the current demand

Bull run will resume once MACD turns green on daily chartFAANG is on long term uptrend. Minor pullback is happening at the moment. Wait for the MACD to turn green on daily time frame to go long.

FAANG Stocks: Ready To FALL? Hidden Fibonacci Pattern FormingTraders, FAANG (Facebook, Apple, Amazon, Netflix and Google) share basket is forming a hidden pattern which can push these stocks down. However there are certain conditions that we must have. In this top down analysis we see how Fibonacci Confluence Pattern (FCP Pattern) is forming a zone which can create a massive trade opportunity.
If you are invested in any of these stocks then you must watch it so that you are aware of this. Also if you are looking for short opportunity because you think markets are over extended, then also you must be aware of this.
I also posted a similar pattern which is appearing on Netflix. Find that in the related ideas below.
Rules:
1. Never trade too much
2. Never trade without a confirmation
3. Never rely on signals, do your own analysis and research too
✅ If you found this idea useful, hit the like button, subscribe and share it in other trading forums.
✅ Follow me for future ideas, trade set ups and the updates of this analysis
✅ Don't hesitate to share your ideas, comments, opinions and questions.
Take care and trade well
-Vik
____________________________________________________
📌 DISCLAIMER
The content on this analysis is subject to change at any time without notice, and is provided for the sole purpose of education only.
Not a financial advice or signal. Please make your own independent investment decisions.
____________________________________________________

Avoided a drop, now we popBroke up, held the line and we're free.
Crypto dies and tech pumps - money moves.

