DAX: Next Move Is Down! Short!
My dear friends,
Today we will analyse DAX together☺️
The recent price action suggests a shift in mid-term momentum. A break below the current local range around 20,299.80 will confirm the new direction downwards with the target being the next key level of 19,659.04.and a reconvened placement of a stop-loss beyond the range.
❤️Sending you lots of Love and Hugs❤️
GER30 trade ideas

short daxThe market seem crazy about the tarrifs and the eventuels compromize between US and China and Europe. But for mee there is not gonna have any compromized, and the market going down

chop EU open into EQI was looking for a long entry but did not take it as I saw no reason for bulls to find support

DAX daily Imbalance Chart Structure & Pattern
The DAX was previously moving within a clear ascending channel, indicating bullish momentum.
A breakdown of this ascending structure has led to a sharp selloff.
Price is now reacting to strong historical demand zones, marked by purple horizontal boxes.
📉 Price Action & Market Behavior
Current price: 19,988.34 EUR
There was a massive drop from the highs around 23,000 EUR to nearly 18,000 EUR.
Today’s candle shows a strong bullish wick, suggesting a bounce off the 18,800–19,200 support zone.
Volume is extremely elevated, indicating capitulation or aggressive repositioning.
📊 RSI (Relative Strength Index)
Current RSI: 27.52 — deeply in oversold territory, which often precedes short-term rebounds or consolidation phases.
If RSI crosses back above 30, that could be a buy trigger for counter-trend traders.
🔍 Key Levels to Watch
Immediate Resistance:
20,800
21,200
Support Zones:
19,200 – 18,800 (currently bouncing from here)
18,000 – 17,600 (next level if current support fails)
📈 Trade Setups
1. Short-Term Rebound / Relief Rally (Bullish Idea):
Entry: Around 19,900–20,000 (after confirmation of support holding)
Target 1: 20,800
Target 2: 21,200
Stop Loss: Below 19,200
2. Bearish Continuation (If support breaks):
Entry: Break below 18,800 with volume
Target: 18,000
Stop Loss: Above 19,300
🧠 Summary
The DAX has sharply broken its bullish structure and is now in a correction phase.
Current bounce from oversold RSI and support zone may give a temporary rally.
However, the overall trend has shifted bearish, and a lower high or failed bounce could trigger further downside.
It's a key inflection point — great for active traders watching for a bounce vs breakdown confirmation.

DAX INTRADAY oversold bounce back capped at 20820The DAX 40 Index is showing a bearish trend, with recent price action breaking below a key support level around 20820. This level acted as a consolidation zone and is now a key resistance.
An oversold bounce from current levels is possible, but if the price fails to break back above 20820, it could head lower toward the next support levels at 19550, 18780, and 17240 over time.
On the other hand, if the index breaks and closes above 20820, the bearish outlook would be invalidated, and the index could move higher to test 21100, and possibly 21870.
Conclusion
Below 20820 = bearish bias remains
Watch for a rejection at 20820 for short setups
Break and daily close above 20820 = shift to bullish outlook targeting higher levels
This communication is for informational purposes only and should not be viewed as any form of recommendation as to a particular course of action or as investment advice. It is not intended as an offer or solicitation for the purchase or sale of any financial instrument or as an official confirmation of any transaction. Opinions, estimates and assumptions expressed herein are made as of the date of this communication and are subject to change without notice. This communication has been prepared based upon information, including market prices, data and other information, believed to be reliable; however, Trade Nation does not warrant its completeness or accuracy. All market prices and market data contained in or attached to this communication are indicative and subject to change without notice.

DAX Shows Upward Reaction from Key Support ZoneThe DAX is feeling the effects of a "Black Monday" scenario early on. The blue trendline that began in August was broken on Friday, and now the longer-term trend that started in October 2023 is being tested. This trendline, along with the major support zone just below it, could act as a potential turning point before a deeper selloff.
If the 18,800–18,920 zone holds, this pullback might turn into a solid buying opportunity. However, there is a clear reason behind the panic selling, and that concern still remains. If fear escalates into full-blown panic and the 18,800–18,920 support zone is broken (not just a bear trap or a temporary downward spike), the rout is likely to continue through the rest of the week.

German 40 Index – Another Potentially Busy Week AheadLast week popular trades were sacrificed in the global risk sell off. The Germany 40 index fell 9% on the week to close at 20,344, a level last seen in early January. The rush into the relative safety of bonds and cash on Thursday/Friday in response to President Trump’s announcement of reciprocal tariffs of 20% on the EU ensured the Germany 40 index moved into correction territory. This is officially a dip of 10% from its previous high of 23,479, which amazingly was only seen 3 weeks ago on March 18th.
The negative mood has carried over into early trading on Monday with the Germany 40 experiencing a gap open lower, which has seen it trade to a new low at 19,592 before finding some initial buying interest again.
Looking forward, US reciprocal tariffs, retaliation and trade war escalation may well be top of traders’ agendas again. The latest round of US tariffs are due to kick in on Wednesday April 9th, making this date potentially pivotal in helping traders to determine whether President Trump is using them as a negotiating tool or is really committed and in it for the long haul.
Also important could be the strength of retaliation from the EU. Weekend news has highlighted a raft of potential measures, ranging from imposing its own tariffs on US imports, higher taxes on US companies or even specifically targeting big American technology companies.
We saw on Friday, what China's strong retaliatory response did to risk sentiment, after the world’s two biggest economies escalated their trade war. A strong response from the EU may have similar consequences, while a more measured approach may provide some support for the Germany 40, and other European indices. This will only become clearer when events occur, and price action can be judged in real time.
Technical Update: Sentiment Changes Everything
A recent theme supporting the Germany 40 index was rotation out of US markets into German assets (i.e. selling of US stocks to reinvest in German companies), which helped maintain the positive price action seen over the first 2 ½ months of 2025.
However, when sentiment changes as dramatically as it appears to have done last week, traders switch to a ‘sell all stocks’ scenario, meaning nothing is safe from capitulation, with even the recent stronger performers, such as the Germany 40, experiencing strong selling pressure.
This activity was reflected within the Germany 40 index by sharp price declines that first saw closing breaks under support provided by the March 11th last correction low at 22240. This then culminated in the sharp acceleration to the downside seen after Wednesday’s reciprocal tariff announcement from President Trump.
What Are The Longer Term Potential Implications for the Germany 40 Index?
Last week’s and so far, this morning’s lower opening, has seen breaks under what would normally be viewed by traders as possible important support, represented by the 38.2% and 50% Fibonacci retracement of August 5th, 2024, to March 18th, 2025, strength. These levels stood at 20945 and 20290 respectively. This may now lead to a more extended phase of price weakness, although it’s not guaranteed.
If this were to be the case traders may begin to look for deeper downside levels which might be viewed as the next potential support within the current decline. It might be argued that this morning’s opening level has already seen a test of a first support at 19653, which is the December 20th session low. However, if it were to give way, it might then be the 61.8% Fibonacci level which stands at 19436, that may become the next downside focus.
How About Potential Resistance Levels?
After such a sharp decline in price over a relatively short period of time, it’s possible to see an upside recovery develop, and it shouldn’t be forgotten that there might be potential for this to occur at some point over the course of the coming week.
However, what might now be viewed as possible resistance to any price bounce?
Friday’s low trade stands at 20318 and if any potential rallies see tests of this level, how it is defended on a closing basis may be important. Successful upside breaks may be a sign that a more extended price rally is materialising. The focus could then switch to a potential stronger resistance at 21076, which is the 38.2% Fibonacci retracement of the March/April weakness.
The material provided here has not been prepared in accordance with legal requirements designed to promote the independence of investment research and as such is considered to be a marketing communication. Whilst it is not subject to any prohibition on dealing ahead of the dissemination of investment research, we will not seek to take any advantage before providing it to our clients.
Pepperstone doesn’t represent that the material provided here is accurate, current or complete, and therefore shouldn’t be relied upon as such. The information, whether from a third party or not, isn’t to be considered as a recommendation; or an offer to buy or sell; or the solicitation of an offer to buy or sell any security, financial product or instrument; or to participate in any particular trading strategy. It does not take into account readers’ financial situation or investment objectives. We advise any readers of this content to seek their own advice. Without the approval of Pepperstone, reproduction or redistribution of this information isn’t permitted.

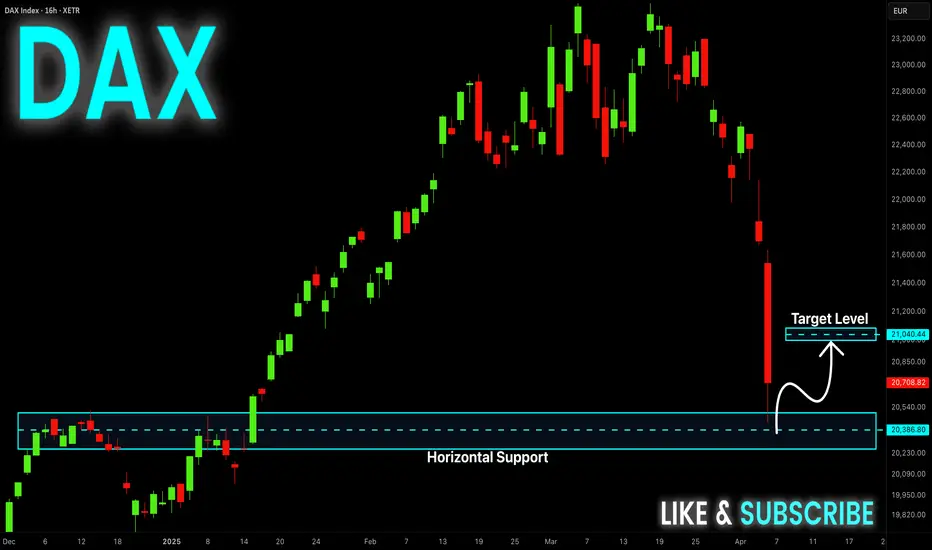
DAX Is Oversold! Buy!
Hello,Traders!
DAX fell down sharply
But will soon hit a
Horizontal support level
Of 20,230 and after the
Retest we will be expecting
A strong bullish rebound
Buy!
Comment and subscribe to help us grow!
Check out other forecasts below too!
Disclosure: I am part of Trade Nation's Influencer program and receive a monthly fee for using their TradingView charts in my analysis.
"GERMANY30" Index CFD Market Heist Plan (Scalping/Day Trade)🌟Hi! Hola! Ola! Bonjour! Hallo! Marhaba!🌟
Dear Money Makers & Robbers, 🤑💰✈️
Based on 🔥Thief Trading style technical and fundamental analysis🔥, here is our master plan to heist the "GERMANY30" Index CFD Market. Please adhere to the strategy I've outlined in the chart, which emphasizes short entry. Our aim is the high-risk Green Zone ATR. Risky level, oversold market, consolidation, trend reversal, trap at the level where traders and bullish robbers are stronger. 🏆💸Book Profits Be wealthy and safe trade.💪🏆🎉
Entry 📈 : "The vault is wide open! Swipe the Bearish loot at any price - the heist is on!
however I advise to Place sell limit orders within a 15 or 30 minute timeframe most nearest or swing, low or high level.
Stop Loss 🛑: (22500) Thief SL placed at the nearest / swing high level Using the 4H timeframe scalping / day trade basis.
SL is based on your risk of the trade, lot size and how many multiple orders you have to take.
Target 🎯: 21400 (or) Escape Before the Target
🧲Scalpers, take note 👀 : only scalp on the Short side. If you have a lot of money, you can go straight away; if not, you can join swing traders and carry out the robbery plan. Use trailing SL to safeguard your money 💰.
"GERMANY30" Index CFD Market Heist Plan (Scalping/Day Trade) is currently experiencing a bearishness,., driven by several key factors.
📰🗞️Get & Read the Fundamental, Macro Economics, COT Report, Geopolitical and News Analysis, Sentimental Outlook, Intermarket Analysis, Index-Specific Analysis, Positioning and future trend targets... go ahead to check 👉👉👉🔗
⚠️Trading Alert : News Releases and Position Management 📰 🗞️ 🚫🚏
As a reminder, news releases can have a significant impact on market prices and volatility. To minimize potential losses and protect your running positions,
we recommend the following:
Avoid taking new trades during news releases
Use trailing stop-loss orders to protect your running positions and lock in profits
💖Supporting our robbery plan 💥Hit the Boost Button💥 will enable us to effortlessly make and steal money 💰💵. Boost the strength of our robbery team. Every day in this market make money with ease by using the Thief Trading Style.🏆💪🤝❤️🎉🚀
I'll see you soon with another heist plan, so stay tuned 🤑🐱👤🤗🤩

"GERMANY 40" Index CFD Market Heist Plan (Day / Swing Trade)🌟Hi! Hola! Ola! Bonjour! Hallo! Marhaba!🌟
Dear Money Makers & Robbers, 🤑💰✈️
Based on 🔥Thief Trading style technical and fundamental analysis🔥, here is our master plan to heist the GER40 "GERMANY 40" Index CFD Market. Please adhere to the strategy I've outlined in the chart, which emphasizes short entry. Our aim is the high-risk Green Zone. Risky level, oversold market, consolidation, trend reversal, trap at the level where traders and bullish robbers are stronger. 🏆💸Book Profits Be wealthy and safe trade.💪🏆🎉
Entry 📈 : "The heist is on! Wait for the breakout (22650) then make your move - Bearish profits await!"
however I advise placing Sell Stop Orders below the breakout MA or Place Sell limit orders within a 15 or 30 minute timeframe. Entry from the most recent or closest low or high level should be in retest. I Highly recommended you to put alert in your chart.
Stop Loss 🛑: Thief SL placed at 23000 (swing / Day Trade Basis) Using the 2H period, the recent / swing high or low level.
SL is based on your risk of the trade, lot size and how many multiple orders you have to take.
Target 🎯: 22000 (or) Escape Before the Target
🧲Scalpers, take note 👀 : only scalp on the Short side. If you have a lot of money, you can go straight away; if not, you can join swing traders and carry out the robbery plan. Use trailing SL to safeguard your money 💰.
GER40 "GERMANY 40" Index CFD Market Heist Plan (Scalping / Day Trade) is currently experiencing a bearishness,., driven by several key factors.
📰🗞️Get & Read the Fundamental, Macro, COT Report, Geopolitical and News Analysis, Sentimental Outlook, Intermarket Analysis, Index-Specific Analysis, Positioning and future trend targets.. go ahead to check 👉👉👉
⚠️Trading Alert : News Releases and Position Management 📰 🗞️ 🚫🚏
As a reminder, news releases can have a significant impact on market prices and volatility. To minimize potential losses and protect your running positions,
we recommend the following:
Avoid taking new trades during news releases
Use trailing stop-loss orders to protect your running positions and lock in profits
📌Please note that this is a general analysis and not personalized investment advice. It's essential to consider your own risk tolerance and market analysis before making any investment decisions.
💖Supporting our robbery plan 💥Hit the Boost Button💥 will enable us to effortlessly make and steal money 💰💵. Boost the strength of our robbery team. Every day in this market make money with ease by using the Thief Trading Style.🏆💪🤝❤️🎉🚀
I'll see you soon with another heist plan, so stay tuned 🤑🐱👤🤗🤩

DAX Stock Chart Fibonacci Analysis 040525Trading Idea
1) Find a FIBO slingshot
2) Check FIBO 61.80% level
3) Entry Point > 20,427/61.80%
Chart time frame: C
A) 15 min(1W-3M)
B) 1 hr(3M-6M)
C) 4 hr(6M-1year)
D) 1 day(1-3years)
Stock progress: C
A) Keep rising over 61.80% resistance
B) 61.80% resistance
C) 61.80% support
D) Hit the bottom
E) Hit the top
Stocks rise as they rise from support and fall from resistance. Our goal is to find a low support point and enter. It can be referred to as buying at the pullback point. The pullback point can be found with a Fibonacci extension of 61.80%. This is a step to find entry level. 1) Find a triangle (Fibonacci Speed Fan Line) that connects the high (resistance) and low (support) points of the stock in progress, where it is continuously expressed as a Slingshot, 2) and create a Fibonacci extension level for the first rising wave from the start point of slingshot pattern.
When the current price goes over 61.80% level , that can be a good entry point, especially if the SMA 100 and 200 curves are gathered together at 61.80%, it is a very good entry point.
As a great help, tradingview provides these Fibonacci speed fan lines and extension levels with ease. So if you use the Fibonacci fan line, the extension level, and the SMA 100/200 curve well, you can find an entry point for the stock market. At least you have to enter at this low point to avoid trading failure, and if you are skilled at entering this low point, with fibonacci6180 technique, your reading skill to chart will be greatly improved.
If you want to do day trading, please set the time frame to 5 minutes or 15 minutes, and you will see many of the low point of rising stocks.
If want to prefer long term range trading, you can set the time frame to 1 hr or 1 day.

DAX RISKY LONG|
✅DAX is going down to retest
A horizontal support of 20,400
Which makes me locally bullish biased
And I think that we will see a rebound
And a move up from the level
Towards the target above at 20,800
LONG🚀
✅Like and subscribe to never miss a new idea!✅
Disclosure: I am part of Trade Nation's Influencer program and receive a monthly fee for using their TradingView charts in my analysis.

DAX reached upper limit of rising wedge - reversal possibleWhen in doubt - zoom out
On Thursday and Friday the DAX / GDAXI reached a high of 21800. Could this be a potential top ?
Looking at the W and M chart (log) the DAX (XETRA) has been trading in a rising wedge since 2003.
With reaching the 21800 level, the DAX has touched the upper line of this rising wedge again. The last time was in April 2015.
The monthly MACD (5 30) has never been this high and the last time the RSI was this high (77) was in 2015 and 2007.
Zooming in on the 5 minute chart (GDAXI), price touched the 21790-21800 region five times in the last two trading days, fell below the current trend line (since Jan 13th), retested it and was rejected to the downside.
There are no certainties in the stock market, but this being at least a local top is quite probable.

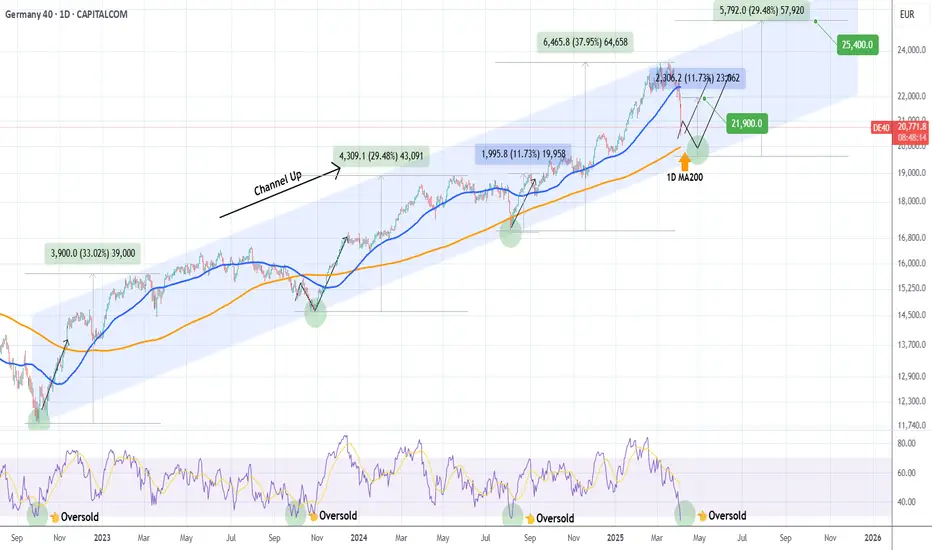
DAX Ultimate buy signal on the 1D MA200 approaching.DAX is having a brutal sell-off, which wasn't technically unexpected as the index made a Higher High on March 06 at the top of its 2.5-year Channel Up. The 1D RSI is already oversold (below 30.00), which is the initial long-term buy signal. Out of the last 3 times the 1D RSI was oversold only on September 26 2023 it extended the downtrend. The other 2 times, it was an immediate buy signal.
The ultimate buy signal, if you want to wait for it, was last time (August 05 2024 Low) when the 1D MA200 (orange trend-line) broke. The minimum rally DAX had following such a bottom was +11.73%, which gives us a short-term Target of 21900 and the maximum (but still the bad case scenario of the 3 Bullish Legs) +29.48%, which gives a long-term Target of 25400.
-------------------------------------------------------------------------------
** Please LIKE 👍, FOLLOW ✅, SHARE 🙌 and COMMENT ✍ if you enjoy this idea! Also share your ideas and charts in the comments section below! This is best way to keep it relevant, support us, keep the content here free and allow the idea to reach as many people as possible. **
-------------------------------------------------------------------------------
💸💸💸💸💸💸
👇 👇 👇 👇 👇 👇
DAX short ideaPTs 20k and 18.7k.
I’m more oriented to the downside once the short term lone has been breached, with a 15% potential drop to test the major trend lines and the 200 day SMA.

Bullish bounce?DAX40 (DE40) is falling towards the pivot and could bounce to the 1st resistance.
Pivot: 21,518.66
1st Support: 21,157.88
1st Resistance: 22,031.65
Risk Warning:
Trading Forex and CFDs carries a high level of risk to your capital and you should only trade with money you can afford to lose. Trading Forex and CFDs may not be suitable for all investors, so please ensure that you fully understand the risks involved and seek independent advice if necessary.
Disclaimer:
The above opinions given constitute general market commentary, and do not constitute the opinion or advice of IC Markets or any form of personal or investment advice.
Any opinions, news, research, analyses, prices, other information, or links to third-party sites contained on this website are provided on an "as-is" basis, are intended only to be informative, is not an advice nor a recommendation, nor research, or a record of our trading prices, or an offer of, or solicitation for a transaction in any financial instrument and thus should not be treated as such. The information provided does not involve any specific investment objectives, financial situation and needs of any specific person who may receive it. Please be aware, that past performance is not a reliable indicator of future performance and/or results. Past Performance or Forward-looking scenarios based upon the reasonable beliefs of the third-party provider are not a guarantee of future performance. Actual results may differ materially from those anticipated in forward-looking or past performance statements. IC Markets makes no representation or warranty and assumes no liability as to the accuracy or completeness of the information provided, nor any loss arising from any investment based on a recommendation, forecast or any information supplied by any third-party.

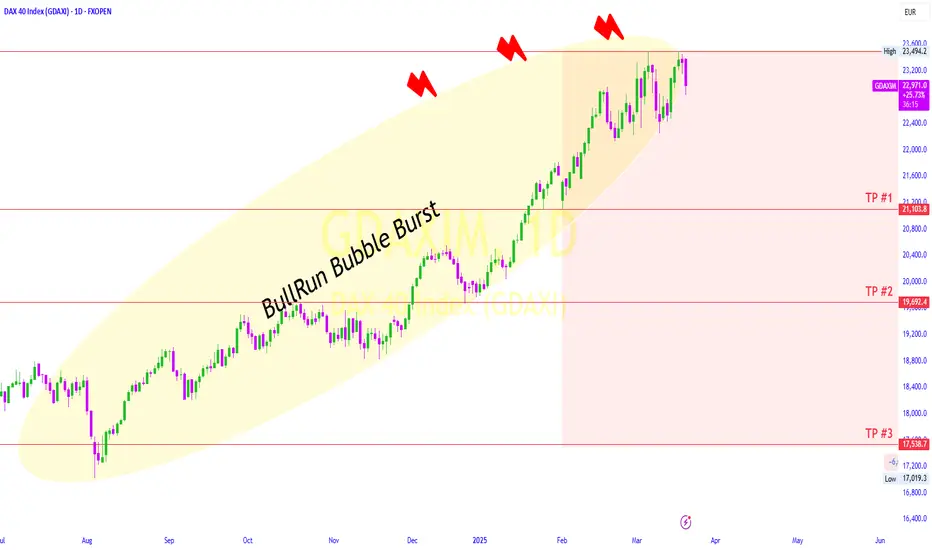
DAX Bull Run Bubble Is Bursting.In 2025, the DAX is projected to experience a significant reversal following a bullish surge that peaked at 23,500 points.
This anticipated downturn is expected to unfold in three distinct steps, marking a bearish correction.
The first step in this decline would see the index retreat to 21,000 points, signaling the initial phase of selling pressure.
The second step is forecasted to bring the index further down to 19,500 points, reflecting mounting concerns and potential profit-taking by investors.
Finally, the third step is projected to culminate in a drop to 17,500 points, completing the retracement and potentially resetting the market for future movements.
This three-step decline underscores the cyclical nature of financial markets and highlights the importance of strategic risk management during periods of heightened volatility.
Investors should closely monitor macroeconomic factors and market sentiment and Candlestick patterns as these levels are approached.
DAX The technical analysis of the DAX suggests a bearish pressure that, if confirmed, could push the market toward the target of 19,828 points. Here are some aspects to consider:
Support and Resistance Levels:
The target of 19,828 might represent an important psychological or technical support level.
If the price falls below intermediate support levels, the bearish objective becomes more plausible.
Patterns and Formations:
The formation of bearish patterns (such as an inverted head and shoulders or a prolonged decline in highs) reinforces the idea of a continuing downtrend.
Volume and Indicator Convergence:
An increase in volume during the downtrend confirms the sellers' interest.
help determine whether the bearish momentum is running out or if there is room for further corrections.
Risk Management:
It is essential to set appropriate stop losses to protect against sudden reversals.
Monitoring price action around key levels can provide useful signals to adjust the strategy.
In summary, if the intermediate supports do not hold and selling pressure continues, the DAX could indeed move toward the target of 19,828 points. However, as always, it is important to remain vigilant and use proper risk management.

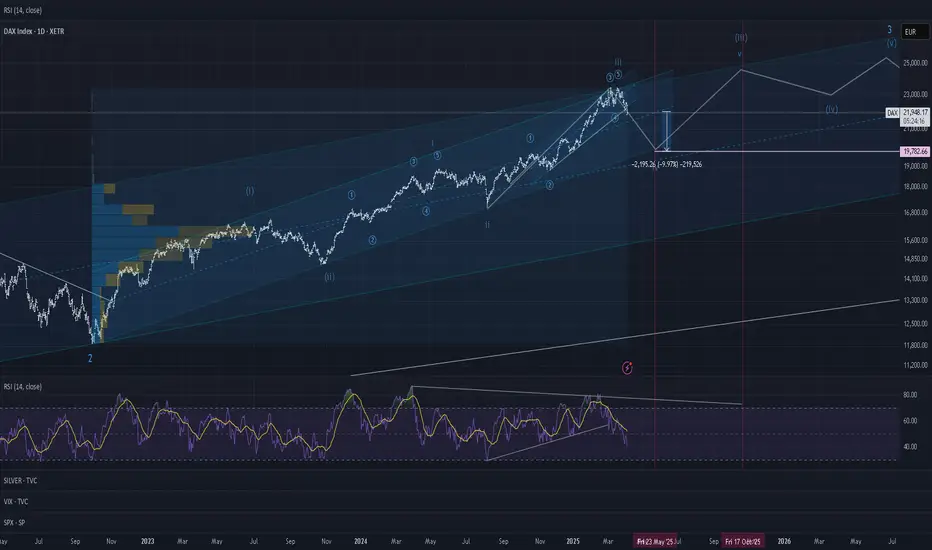
DAX bearish. Expecting 10% declineBased on trends, EW, volume, RSI it seems realistic to have DAX declining by 10% from here before finalizing the uptrend starting end of May.
DAX40 INTRADAY corrective pullback capped at 22144The DAX 40 remains in a bearish trend, with recent price action suggesting an oversold bounce rather than a structural reversal.
Key Levels & Scenarios
Resistance: 22144 (previous intraday consolidation zone)
A bearish rejection from this level could resume downside momentum.
Support targets: 21544, followed by 21300 and 21000 over a longer timeframe.
Bullish Breakout Scenario:
A confirmed breakout above 22144 with a daily close above this level would invalidate the bearish outlook.
Upside targets: 22385 (next resistance), followed by 22685.
Indicators & Market Sentiment
RSI suggests the market was oversold, leading to the current bounce.
Volume analysis indicates weak bullish momentum, reinforcing the bearish bias unless 22144 is breached.
Conclusion
The prevailing bearish trend remains intact unless DAX 40 breaks and holds above 22144. Traders should watch for bearish rejection at this level for downside continuation or a daily close above 22144 for a shift to bullish momentum.
This communication is for informational purposes only and should not be viewed as any form of recommendation as to a particular course of action or as investment advice. It is not intended as an offer or solicitation for the purchase or sale of any financial instrument or as an official confirmation of any transaction. Opinions, estimates and assumptions expressed herein are made as of the date of this communication and are subject to change without notice. This communication has been prepared based upon information, including market prices, data and other information, believed to be reliable; however, Trade Nation does not warrant its completeness or accuracy. All market prices and market data contained in or attached to this communication are indicative and subject to change without notice.

A high probability short setup on GER40! Hello traders,
GER40 is flashing a prime shorting opportunity! On the higher timeframe, the index has formed a double top, a classic reversal pattern. The setup has been confirmed with a decisive neckline break, signaling strong bearish momentum.
I'm watching for a slight pullback to the neckline, where I'll be looking to enter short positions. My initial target is 21,637, with an extended move down to 21,112 if sellers maintain control.
Stay tuned for updates, and if you find this analysis valuable, give it a boost! Let’s catch this move together. 🚀🔥

DAX H4 | Downtrend to extend further?DAX (GER30) is rising towards a pullback resistance and could potentially reverse off this level to drop lower.
Sell entry is at 22,277.36 which is a pullback resistance that aligns with the 50.0% Fibonacci retracement.
Stop loss is at 22,640.00 which is a level that sits above an overlap resistance.
Take profit is at 21,746.73 which is a swing-low support that aligns close to the 78.6% Fibonacci projection.
High Risk Investment Warning
Trading Forex/CFDs on margin carries a high level of risk and may not be suitable for all investors. Leverage can work against you.
Stratos Markets Limited (www.fxcm.com):
CFDs are complex instruments and come with a high risk of losing money rapidly due to leverage. 63% of retail investor accounts lose money when trading CFDs with this provider. You should consider whether you understand how CFDs work and whether you can afford to take the high risk of losing your money.
Stratos Europe Ltd (www.fxcm.com):
CFDs are complex instruments and come with a high risk of losing money rapidly due to leverage. 63% of retail investor accounts lose money when trading CFDs with this provider. You should consider whether you understand how CFDs work and whether you can afford to take the high risk of losing your money.
Stratos Trading Pty. Limited (www.fxcm.com):
Trading FX/CFDs carries significant risks. FXCM AU (AFSL 309763), please read the Financial Services Guide, Product Disclosure Statement, Target Market Determination and Terms of Business at www.fxcm.com
Stratos Global LLC (www.fxcm.com):
Losses can exceed deposits.
Please be advised that the information presented on TradingView is provided to FXCM (‘Company’, ‘we’) by a third-party provider (‘TFA Global Pte Ltd’). Please be reminded that you are solely responsible for the trading decisions on your account. There is a very high degree of risk involved in trading. Any information and/or content is intended entirely for research, educational and informational purposes only and does not constitute investment or consultation advice or investment strategy. The information is not tailored to the investment needs of any specific person and therefore does not involve a consideration of any of the investment objectives, financial situation or needs of any viewer that may receive it. Kindly also note that past performance is not a reliable indicator of future results. Actual results may differ materially from those anticipated in forward-looking or past performance statements. We assume no liability as to the accuracy or completeness of any of the information and/or content provided herein and the Company cannot be held responsible for any omission, mistake nor for any loss or damage including without limitation to any loss of profit which may arise from reliance on any information supplied by TFA Global Pte Ltd.
The speaker(s) is neither an employee, agent nor representative of FXCM and is therefore acting independently. The opinions given are their own, constitute general market commentary, and do not constitute the opinion or advice of FXCM or any form of personal or investment advice. FXCM neither endorses nor guarantees offerings of third-party speakers, nor is FXCM responsible for the content, veracity or opinions of third-party speakers, presenters or participants.

