#NDQ - Weekly Targets 23197.39 or 21886.08 ?Date: 03-07-2025
#NDQ - Current Price: 22641.89
Pivot Point: 22541.74 Support: 22335.83 Resistance: 22748.58
#NDQ Upside Targets:
Target 1: 22832.49
Target 2: 22916.40
Target 3: 23056.89
Target 4: 23197.39
#NDQ Downside Targets:
Target 1: 22251.45
Target 2: 22167.08
Target 3: 22026.58
Target 4: 21886.08
NAS100 trade ideas

US100 Market Open BuyLooking for a liquidity buy on US100 at market open. Allow the price to open a push a little down towards the trigger line at 22700. Target will be a +150 pip move up to 22850.

Nasdaq update I shared nasdaq long term set up,according to my view to move with trend in higher time frames is easy to follow the trend n it's pull backs and is also important to know what is driving the market it helps you to not be surprised by spikes but understand them,it takes time to understand the market but once you reach this level of holding trades it becomes less stressful n more profitable, nasdaq breakout 22000 n is likely to test the brakes n continue to climb,I believe we still gonna see a little big rejection last one for the year n followed by biggest bull run ever tarrif are coming back in full 1 August soo another strong rejection will occur but it won't last longer n it won't be big like the first one,is very important to understand what is moving n why more than just drawing a graph,draw graphs n make sure you are moving with the trend n don't be afraid focus n follow right people's for your mental health n growth not everyone is good for you.

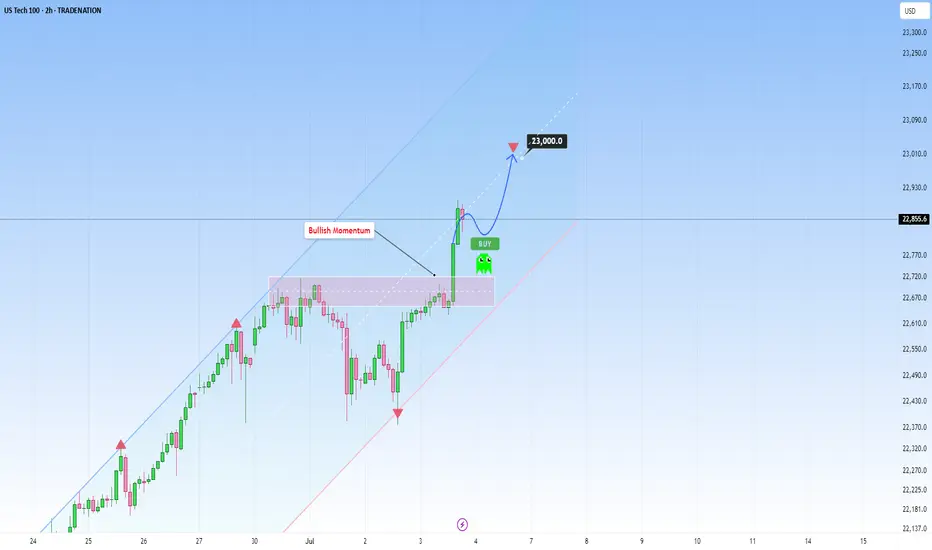
NASDAQ 100: Breakout Confirmed — Targeting 23,023Market Overview:
The NASDAQ 100 is showing strong bullish momentum within its ascending channel. After forming an ABCD pattern and breaking above the buy level at 22,745, the price accelerated upward and is approaching the target resistance zone at 23,023.
Technical Signals & Formations:
— ABCD pattern in play
— EMA supports bullish momentum
— Breakout above buy zone at 22,745
— Target is the upper channel boundary and resistance at 23,023
Key Levels:
Support: 22,681, 22,620
Resistance/Target: 23,023
Scenario:
Primary: If the price holds above 22,745, the bullish continuation toward 23,023 remains the main scenario.
Alternative: A drop below 22,681 may lead to a correction toward 22,620 and increase bearish pressure.

NAS100 SELLTake trade on your own risk!
still moving on the downtrend to the next supply & demand zone, no sign of reversal.
Set TP: 22,755

Bollinger Bands: How to Stop Being a Slave to the Markets.Bollinger Bands are a technical analysis indicator widely used in trading to assess the volatility of a financial asset and anticipate price movements. Created in the 1980s by John Bollinger, they consist of three lines superimposed on the price chart:
The middle band: a simple moving average, generally calculated over 20 periods.
The upper band: the moving average to which two standard deviations are added.
The lower band: the moving average to which two standard deviations are subtracted.
These bands form a dynamic channel around the price, which widens during periods of high volatility and narrows when the market is calm. When a price touches or exceeds a band, it can signal an overbought or oversold situation, or a potential trend reversal or continuation, depending on the market context.
What are Bollinger Bands used for?
Measuring volatility: The wider the bands, the higher the volatility.
Identify dynamic support and resistance zones.
Detect market excesses: A price touching the upper or lower band may indicate a temporary excess.
Anticipate reversals or consolidations: A tightening of the bands often heralds an upcoming burst of volatility.
Why is the 2-hour time frame so widely used and relevant?
The 2-hour (H2) time frame (TU) is particularly popular with many traders for several reasons:
Perfect balance between noise and relevance: The H2 offers a compromise between very short time frames (often too noisy, generating many false signals) and long time frames (slower to react). This allows you to capture significant movements without being overwhelmed by minor fluctuations.
Suitable for swing trading and intraday trading: This TU allows you to hold a position for several hours or days, while maintaining good responsiveness to take advantage of intermediate trends.
Clearer reading of chart patterns: Technical patterns (triangles, double tops, Wolfe waves, etc.) are often clearer and more reliable on H2 than on shorter time frames, making decision-making easier.
Less stress, better time management: On H2, there's no need to constantly monitor screens. Monitoring every two hours is sufficient, which is ideal for active traders who don't want to be slaves to the market.
Statistical relevance: Numerous backtests show that technical signals (such as those from Bollinger Bands) are more robust and less prone to false signals on this intermediate time frame.
In summary, the 2-hour time frame is often considered "amazing" because it combines the precision of intraday trading with the reliability of swing trading, thus providing superior signals for most technical strategies, particularly those using Bollinger Bands.
To summarize
Bollinger Bands measure volatility and help identify overbought/oversold areas or potential reversals.
The 2-hour timeframe is highly valued because it filters out market noise while remaining sufficiently responsive, making it particularly useful for technical analysis and trading decision-making.

NASDAQ After the Fireworks: Bearish Setup LoadedAfter the classic 4th of July rally, I stepped in on the short side of Nasdaq, targeting 22,000 and 21,400 zones. The market structure shows exhaustion, and with the cloud retest failing to hold new highs, I positioned accordingly.
Technical:
• Price stalled at prior expansion highs with tight compression near 23,000.
• Daily FibCloud offered resistance confirmation.
• Bearish risk-reward skew forms after extended rally and thin retraces.
• Volume divergence spotted.
Fundamentals:
Multiple overlapping uncertainties:
• Trump confirmed tariffs will take effect on August 1, threatening a 10% surcharge on BRICS-aligned nations.
• Treasury Secretary Bessent anticipates several trade deal announcements within 48h—but stresses quality over quantity.
• Bank of America maintains its base case of 0 rate cuts in 2025, citing strong economic data and sticky inflation risks.
The combination of tariff escalation, hawkish monetary expectations, and global trade friction creates a perfect backdrop for volatility and correction—especially in overextended tech indices like the Nasdaq.
Note: Please remember to adjust this trade idea according to your individual trading conditions, including position size, broker-specific price variations, and any relevant external factors. Every trader’s situation is unique, so it’s crucial to tailor your approach to your own risk tolerance and market environment.

NASDAQ Potential Bearish Reversal Analysis NASDAQ Potential Bearish Reversal Analysis 🧠🔻
The chart illustrates a potential bearish setup forming after a recent uptrend in NASDAQ. Let's break it down professionally:
🔍 Technical Overview:
Ascending Trendline Break ✅
Price had been respecting a steady ascending trendline.
A break below this trendline indicates a possible momentum shift from bullish to bearish.
Bearish Pattern Formation 🔷
A bearish flag/pennant-like formation can be observed after the sharp rise.
This consolidation followed by a breakdown could be a continuation pattern, hinting at further downside.
Resistance Rejection 🔴
A red arrow marks a clear rejection from the resistance zone near 22,800 USD.
Strong wick rejections and bearish candles suggest selling pressure at that level.
Support Turned Resistance (SUPPOT 🛑)
The previously broken support zone is now acting as resistance (note: "SUPPOT" appears misspelled—should be "SUPPORT").
Bearish Target Zone 🎯
The chart marks a "TAEGET" zone (should be "TARGET") near the 21,900 – 22,000 USD range.
This aligns with prior consolidation and demand zones, making it a likely area for price to retrace.
📌 Key Zones:
Resistance (Rejection Area): 22,800 USD
Current Price: 22,739.7 USD
Bearish Target Zone: 21,900 – 22,000 USD
⚠️ Conclusion:
The market shows signs of a bearish reversal with a confirmed trendline break, resistance rejection, and bearish pattern formation. If the price fails to reclaim the 22,800 level, there’s a high probability of downward continuation toward the 22,000 target.

Nasdaq 100: Bearish Signals Near the All-Time HighNasdaq 100: Bearish Signals Near the All-Time High
As the 4-hour chart of the Nasdaq 100 (US Tech 100 mini on FXOpen) shows, the index reached a new all-time high last week. However, the price action suggests that the current pace of growth may not last.
Last week’s strong labour market data triggered a significant bullish impulse. However, the upward momentum has been entirely retraced (as indicated by the arrows).
The tax cut bill signed on Friday, 4 July, by Trump — which is expected to lead to a significant increase in US government debt — contributed to a modest bullish gap at today’s market open. Yet, as trading progressed during the Asian session, the index declined.
This suggests that fundamental news, which could have served as bullish catalysts, are failing to generate sustainable upward movement — a bearish sign.
Further grounds for doubt regarding the index's continued growth are provided by technical analysis of the Nasdaq 100 (US Tech 100 mini on FXOpen) chart, specifically:
→ a bearish divergence on the RSI indicator;
→ price proximity to the upper boundary of the ascending channel, which is considered resistance.
It is reasonable to suggest that the market may be overheated and that bullish momentum is waning. Consequently, a correction may be forming — potentially involving a test of the 22,100 level. This level acted as resistance from late 2024 until it was broken by strong bullish momentum in late June.
This article represents the opinion of the Companies operating under the FXOpen brand only. It is not to be construed as an offer, solicitation, or recommendation with respect to products and services provided by the Companies operating under the FXOpen brand, nor is it to be considered financial advice.

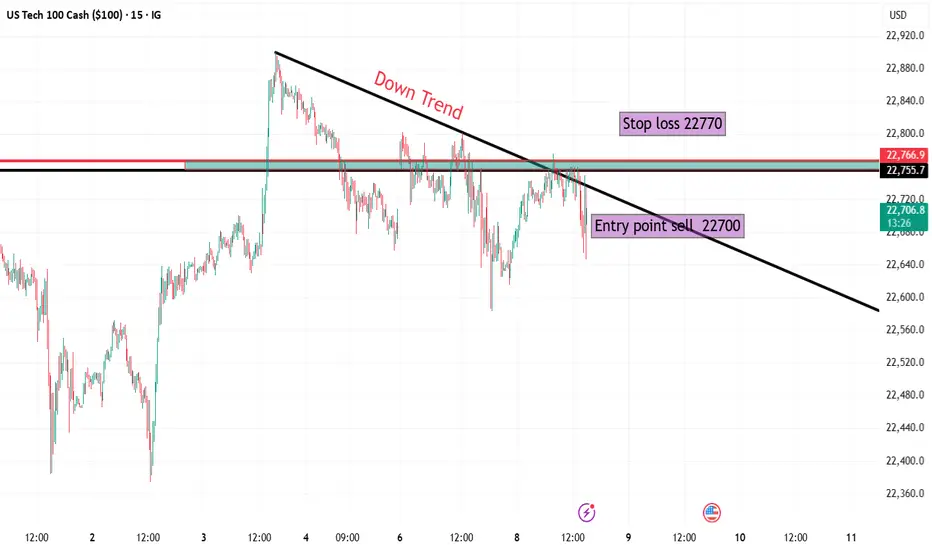
NASDAQ 🔍 Market Overview:
Instrument: US Tech 100 (NASDAQ 100)
Timeframe: 15 Minutes
Current Trend: Short-term downtrend, indicated by the descending trendline connecting recent lower highs.
📉 Trade Setup (Short Position):
Entry Point: 22,700
Price has broken below the trendline and a horizontal resistance zone around 22,750–22,770, confirming bearish pressure.
Stop Loss: 22,770
Placed just above the previous resistance and trendline. A break above this level would invalidate the downtrend structure.
Target: 22,070
This level aligns with a previously tested demand/support zone, offering a logical take-profit area.
📊 Risk/Reward Analysis:
Risk: ~100 points
Reward: ~640 points
Risk-to-Reward Ratio: 1:6, which is excellent and indicates a high potential reward relative to the risk.
📌 Technical Observations:
Trendline: Clearly established downtrend with lower highs.
Breakout Confirmation: Price rejected from trendline + horizontal resistance = confluence zone.
Volume & Momentum (not shown but advisable to check): Traders should confirm the breakout with increased selling volume or bearish momentum indicators (e.g., RSI dropping below 50 or MACD crossing down).
✅ Conclusion:
This is a well-structured short (sell) setup with:
Clear trendline rejection,
Defined entry, stop loss, and target,
A favorable risk-to-reward ratio.
US100 SELLERS WILL DOMINATE THE MARKET|SHORT
US100 SIGNAL
Trade Direction: short
Entry Level: 22,684.7
Target Level: 22,082.0
Stop Loss: 23,085.2
RISK PROFILE
Risk level: medium
Suggested risk: 1%
Timeframe: 10h
Disclosure: I am part of Trade Nation's Influencer program and receive a monthly fee for using their TradingView charts in my analysis.
✅LIKE AND COMMENT MY IDEAS✅

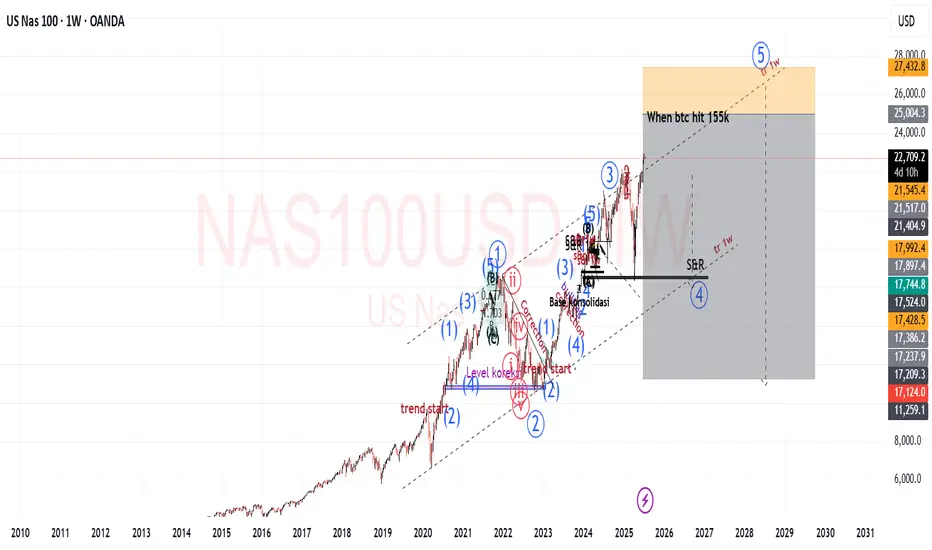
Nas100 is Still Correcting Nasdaq is Correcting
Long Term we are still Bullish
Remember that markets hunt liquidity
The short term trend is Lower Highs and Lower Lows
Price is still in Premium For Sells
Looking for a retest of previous short term high and my TP would be around 22580
The only way I would get into a buy trade if price would retest the current support and hold with very bullish price action. No little candles etc.

"NASDAQ 100: THE TECH ROBBERY! – Quick Profits Before Reversal?"🔥 "The NDX NASDAQ 100 INDEX Heist: Bullish Loot & Escape Before the Trap!" 🔥
🌟 Hi! Hola! Ola! Bonjour! Hallo! Marhaba! 🌟
Dear Money Makers & Market Robbers, 🤑💰💸✈️
Based on the 🔥Thief Trading Style🔥 (technical + fundamental analysis), here’s our master plan to heist the NDX - NASDAQ 100 INDEX. Follow the strategy on the chart—long entry is the play! Aim to escape near the high-risk RED Zone (overbought, consolidation, potential reversal). The bears are lurking, so take profits and treat yourself—you’ve earned it! 💪🏆🎉
🚀Entry (The Vault is Open!)
"Swipe the bullish loot at any price!"
For precision, place buy limit orders within 15-30min timeframe (recent swing lows/highs).
Set alerts! Don’t miss the heist.
🛑 Stop Loss (Safety Net)
Thief-style SL at nearest swing low (4H timeframe) → 21,770.00 (adjust based on risk/lot size).
🏴☠️ Target 🎯: 22,800.00
Bullish momentum is fueling this heist—ride the wave but exit before the trap!
📰 Fundamental Backing (Why This Heist Works)
Macroeconomic trends, COT data, geopolitics, and sentiment align for bullish moves.
Full analysis? Check 👉🔗🌎
⚠️ Trading Alerts (News & Risk Mgmt)
Avoid new trades during high-impact news (volatility = danger).
Use trailing stops to lock profits and dodge sudden reversals.
💥 Boost This Heist!
Hit 👍 (Boost Button) to strengthen our robbery squad!
More heists = More profits—stay tuned for the next steal! 🚀🤑
See you soon, fellow thieves! 🤝🎉

Upward momentum of Nasdaq paused by consolidationUpward momentum of Nasdaq paused by consolidation. Now resting on support of trendline. It may continue its upward momentum next week.

US100 (Nasdaq 100) - Future Outlook (as of mid-July 2025)The US100, which is heavily concentrated in technology and growth companies, has been a significant driver of overall market performance in recent times. Its future trajectory is intricately linked to a combination of macroeconomic trends, corporate earnings, and evolving technological narratives.
Key Factors Shaping the Outlook:
Monetary Policy and Inflation Dynamics:
Cooling Inflation: If inflation continues to moderate (as indicated by CPI, PCE, and other economic data), central banks, particularly the U.S. Federal Reserve, will have more flexibility to consider easing monetary policy.
Interest Rate Expectations: Lower interest rates are generally a boon for growth stocks. They reduce the cost of borrowing for companies and increase the present value of their future earnings, which makes their (often higher) valuations more palatable. Conversely, any resurgence in inflation that forces a "higher for longer" interest rate stance could put significant downward pressure on the US100. As of mid-2025, the market has largely priced in the expectation of potential rate cuts later in 2025 or early 2026, but this remains highly data-dependent and subject to change with each new economic report.
C orporate Earnings and AI Enthusiasm:
Tech Earnings Season: The performance of the major tech titans within the Nasdaq 100 (e.g., Apple, Microsoft, Amazon, Google, Nvidia, Meta, Tesla) during their quarterly earnings reports will be critical. Continued strong earnings beats, particularly from companies that are leading the charge in Artificial Intelligence (AI), will reinforce investor confidence and support higher valuations.
Artificial Intelligence (AI) Narrative: The intense excitement and significant investment surrounding AI remain a powerful tailwind for the US100. Companies demonstrating clear pathways to monetize AI, or those establishing dominant positions in AI infrastructure and applications, are likely to continue seeing robust performance. However, any signs of the AI narrative losing steam, or a perception of an AI "bubble," could trigger profit-taking or a broader market correction.
Economic Growth and Consumer Behavior:
U.S. Economic Health: A resilient U.S. economy, characterized by healthy GDP growth and a strong labor market, provides a conducive environment for corporate revenues. A "soft landing" scenario (where inflation is tamed without triggering a recession) is the most favorable outcome for the US100.
Consumer Spending: Strong consumer confidence and sustained spending directly benefit sectors like e-commerce, software services, and consumer electronics, which are heavily represented in the Nasdaq 100.
Valuation Considerations:
While many Nasdaq 100 companies have delivered impressive earnings growth, their valuations (e.g., P/E ratios) are, for some, elevated compared to historical averages. This implies that there might be less margin for error in future earnings reports or unexpected shifts in the economic landscape. A "valuation reset" could occur if growth projections fail to materialize or if interest rates remain higher than currently anticipated.
Geopolitical and Global Factors:
Global Trade & Geopolitics: Ongoing global trade dynamics, geopolitical tensions (e.g., US-China relations, regional conflicts), and potential supply chain disruptions can introduce unforeseen volatility and impact global economic growth, which, in turn, affects the predominantly international-facing tech sector.
Overall Future Outlook (from a mid-July 2025 perspective):
The US100's future outlook appears cautiously optimistic, primarily driven by the enduring strength of underlying technology trends and the transformative potential of AI. The index has demonstrated remarkable resilience and continues to be favored by growth-oriented investors.
Upside Potential: Could be fueled by sustained strong earnings from its tech giants, especially those leading in AI, coupled with clear indications of forthcoming interest rate cuts.
Downside Risks: The index remains highly susceptible to shifts in interest rate expectations (e.g., if inflation proves stickier than anticipated), any disappointments in high-profile tech earnings, or a broader economic downturn. Given its concentration in high-growth, high-beta stocks, the US100 is prone to more significant fluctuations in both upward and downward market moves compared to broader, more diversified indices.
Investors and traders will be closely monitoring key economic data (inflation, employment), central bank communications, and the performance of bellwether tech companies for crucial clues about the index's direction.
⚠️ Disclaimer: This post is educational content and does not constitute investment advice, financial advice, or trading recommendations. The views expressed here are based on technical analysis and are shared solely for informational purposes. The stock market is subject to risks, including capital loss, and readers should exercise due diligence before investing. We do not take responsibility for decisions made based on this content. Consult a certified financial advisor for personalized guidance
For those interested in further developing their trading skills based on these types of analyses, consider exploring the mentoring program offered by Shunya Trade.
I welcome your feedback on this analysis, as it will inform and enhance my future work

Nasdaq Analysis 07-Jul-25In this video we are discussing the main fundamental reason behind Nasdaq bullish momentum.
In addition to area if interest with possible scenarios.
Disclaimer: easyMarkets Account on TradingView allows you to combine easyMarkets industry leading conditions, regulated trading and tight fixed spreads with TradingView's powerful social network for traders, advanced charting and analytics. Access no slippage on limit orders, tight fixed spreads, negative balance protection, no hidden fees or commission, and seamless integration.
Any opinions, news, research, analyses, prices, other information, or links to third-party sites contained on this website are provided on an "as-is" basis, are intended only to be informative, is not an advice nor a recommendation, nor research, or a record of our trading prices, or an offer of, or solicitation for a transaction in any financial instrument and thus should not be treated as such. The information provided does not involve any specific investment objectives, financial situation and needs of any specific person who may receive it. Please be aware, that past performance is not a reliable indicator of future performance and/or results. Past Performance or Forward-looking scenarios based upon the reasonable beliefs of the third-party provider are not a guarantee of future performance. Actual results may differ materially from those anticipated in forward-looking or past performance statements. easyMarkets makes no representation or warranty and assumes no liability as to the accuracy or completeness of the information provided, nor any loss arising from any investment based on a recommendation, forecast or any information supplied by any third-party.

NasdaqNon-commercials (hedge funds, asset managers, etc.) are adding significant long exposure.
This usually reflects confidence in continued upside, often in line with strong tech earnings, soft landing narratives, or a dovish Fed.
Bias: Bullish
Large speculators significantly increased long exposure on Nasdaq futures, showing strong confidence in continued upside momentum. This aligns with recent tech-led rallies and soft-landing expectations.

Clear uptrend continuation to 23000+As you can see. We are ascending. All details on chart.
Beware of over leveraged trades. Shorts especially.
NASDAQ:TQQQ NASDAQ:QQQ SKILLING:US100

US100 - Reversal after liquidity sweep to target new highs?The chart presented shows a 1-hour analysis of the US100 (Nasdaq 100), illustrating a clean and structured price action narrative. Initially, we observe that the market swept liquidity at the lows, indicated by a sharp wick that pierced beneath the previous support levels. This type of liquidity sweep is common when smart money looks to grab stop-loss orders before reversing the trend.
Liquidity sweep to the downside
Following this liquidity sweep, price action aggressively moved upwards, breaking a lower high structure that had previously marked the bearish control of the market. This break of structure is a key bullish signal, suggesting a shift in momentum from bearish to bullish, and often signifies the beginning of a new upward leg.
1H FVG
An important element on this chart is the 1-hour Fair Value Gap (FVG), initially acting as a bearish imbalance. However, due to the strong bullish momentum, price not only reclaimed this level but did so decisively. As a result, this bearish FVG is now considered a bullish FVG, indicating that it may serve as a support zone on any short-term pullback.
Liquidity taken from the upside
After reclaiming the FVG and breaking structure, price surged further, taking out upside liquidity just above recent highs. This action typically leads to a short-term pullback, as profit-taking and new supply enter the market. The chart suggests that any retracement may find support at the 1H FVG, providing a potential entry point for bullish continuation.
Conclusion
In conclusion, the US100 demonstrated a textbook liquidity grab at the lows, followed by a break in bearish structure, a shift in momentum, and an inversion of a key FVG zone from bearish to bullish. The short-term upside liquidity has been cleared, and the next logical target is the high marked on the chart. Should the price respect the newly formed bullish FVG on any pullback, we can expect continuation toward that upper high, completing the bullish run.
Disclosure: I am part of Trade Nation's Influencer program and receive a monthly fee for using their TradingView charts in my analysis.
Thanks for your support.
- Make sure to follow me so you don't miss out on the next analysis!
- Drop a like and leave a comment!

Nasdaq Approaches 23,000 Mark for the First TimeOver the past five trading sessions, the U.S. Nasdaq index has posted a gain of more than 1.5%, supported by a recent rise in market confidence that has pushed the equity index to new all-time highs. The NFP employment data released yesterday surprised markets with 147,000 new jobs, compared to the 111,000 expected, reflecting a recovery in the labor market that could ultimately support domestic consumption in the U.S.. This has helped maintain investor confidence in equities, supporting a bullish bias in the Nasdaq in recent sessions.
Sustained Uptrend
Since the early days of April, the Nasdaq has maintained a solid upward trend, with no relevant signs of selling pressure that would threaten the current bullish structure. As a result, the long-term bias remains clearly bullish within the broader market outlook. However, it's worth noting that a growing sense of indecision has emerged in recent sessions, reflected in the candlestick patterns, which could open the door to short-term bearish corrections.
Technical Indicators
MACD: The MACD histogram continues to hover around the neutral zero line, indicating a balance in moving average strength during recent sessions. If this pattern continues, it may result in a more defined period of price neutrality in the short term.
RSI: The presence of consistent RSI highs, alongside higher price highs in the Nasdaq, has led to the formation of a bearish divergence. This suggests that market equilibrium has been affected by recent bullish momentum, and could lead to price pullbacks in the upcoming sessions.
Key Levels to Watch:
23,000 – Psychological barrier: A tentative resistance level in the short term due to the lack of clear technical references. A breakout above this level could reinforce the current bullish bias and signal a more sustained upward trend.
21,800 – Nearby support: An area aligned with a recent neutral technical zone, which may act as relevant support in the event of a short-term pullback.
21,000 – Key support: A level that coincides with the 50-period simple moving average. A break below this level could put the current bullish structure at risk and pave the way for a more significant downward move.
Written by Julian Pineda, CFA – Market Analyst

NASDAQ 100 TRADING PLAN
⸻
🧠 US100 Multi-Timeframe Playbook
(W1 → D1 → H4 → M30 → M5)
⸻
🔹 Higher Timeframe Context
WEEKLY (Strong Uptrend):
• Key Levels:
– ATH supply: 22,800–23,000
– Support shelf (prior resistance): 22,100–22,200
– 50-SMA: 20,400
– 200-SMA: 16,100
• Summary: Bullish structure is intact as long as price holds above 22,100–22,200 and the long-term trendline.
DAILY (Bullish but stretched):
• Key Levels:
– Upper Bollinger Band: 23,025
– Mid-band & 20-SMA: 22,430
– 50-SMA: 21,985
• Summary: RSI at 66 and MACD > 0 but flattening. This suggests bullish momentum may be cooling — odds of a pause or pullback rising.
4-HOUR (Wedge – Late-Trend Exhaustion Risk):
• Key Levels:
– Rising wedge: upper rail ≈ 23,200, lower ≈ 22,450
– 8-EMA: 22,655 | 21-EMA: 22,425
– Anchored VWAP (from June low): 22,350
• Summary: Ribbon still bullish, but volume and MACD momentum are plateauing. A break below 22,450/VWAP confirms a corrective leg.
30-MINUTE (Neutral to Weak):
• Key Levels:
– Descending micro-trendline: 22,725
– Rising support: 22,690
– Session range: High = 22,845 | Low = 22,690
• Summary: Price is coiled near the apex. EMAs curling downward. Market decision point imminent.
5-MINUTE (Immediate Bear Bias):
• Key Levels:
– Live VWAP: 22,752
– 9-EMA sloping down
– Stochastic: mid-range
• Summary: Price remains below VWAP and 9-EMA. Short-term sellers in control unless VWAP is reclaimed.
⸻
📈 Trade Setups
1. Swing Long – Buy the Dip
• Let price wash through 22,450–22,350 (H4 wedge floor + VWAP zone)
• Enter if:
– 30m bullish engulfing or hammer closes back above 22,450
– AND 5m VWAP is reclaimed
• Initial Stop: Below liquidity sweep or 22,300 – whichever is lower – minus 0.25 × ATR(14, H4) ≈ 30 pts → around 22,270
• Targets:
– T1: 22,845
– T2: 23,200
– Leave runner for blue-sky continuation
• Comment: With weekly trend. Wait for deep retracement. Great RR ≈ 1:3+
⸻
2. Intraday Short – Mean Reversion
• Trigger Zone: 22,725–22,760 (broken trendline + 5m VWAP)
• Enter if:
– 5m rejection wick or bearish engulfing forms on avg+ volume
• Stop: Above 22,800 + buffer (≈ 22,820)
• Targets:
– T1: 22,600
– T2: 22,450
– Optional T3: 22,350 (VWAP)
• Comment: Counter-trend, so treat as scalp. Tight stops. Demand at least 1:2 RR.
⸻
3. Breakout Long – Trend Continuation
• Entry Criteria:
– 30m close above 22,845 with 150%+ average volume
– 5m bull flag holds above breakout level
• Stop:
– First 30m candle close back inside the range
– Or 22,770 (flag base) — whichever happens first
• Targets:
– T1: 23,025 (Daily BB)
– T2: 23,300 (measured move)
• Comment: Only take if strong volume confirms new participation. Avoid during Asia or illiquid hours.
⸻
⚙️ Execution & Risk Guidelines
• Risk per trade: ≤ 1% account (limit counter-trend trades to 0.5%)
• Sizing formula:
Contracts = Account Risk / (Stop pts × $ per pt)
• ATR reference:
– ATR(14, H4) ≈ 120 pts
– ATR(14, 30m) ≈ 80 pts
• Move stop to break-even once price moves 0.75 × stop distance in your favor
• Never run trades #2 and #3 at the same time → directional conflict
• Watch out for macro data (e.g., NFP, CPI) — can override intraday structure
⸻
⏱ What to Watch (In Sequence)
1. Overnight – Does price stay pinned below the 30m 21-EMA, or start to float above it?
2. London Open – First test of the 22,725–22,760 zone: fade or reclaim?
3. NY Open – Volume surge confirms either breakout (#3) or fade setup (#2)
4. End of Day – A close below 22,450 on volume = deeper pullback risk toward 22,000 next week
⸻
🔍 Final Thoughts
The trend is still your friend — but the daily and H4 chart are stretched. Let the trade come to you:
• Buy the flush only if we dip into confluence support and reclaim key levels (#1)
• Buy the breakout only if high volume confirms continuation (#3)
• Everything in-between is a scalp fade (#2) — execute cleanly, with defined risk, and respect trend structure.
This is for educational purposes. Fit these into your system and risk tolerance.
⸻

US100 rises sharply, with further upside target of 23,000At this stage, US100 continues to ride a dominant ascending channel structure, maintaining a consistent bullish structure supported by strong fundamentals as well as technical positioning.
The current price action reflects a high-confidence trend environment, underpinned by steady economic resilience in the U.S. tech sector and growing investor optimism surrounding AI-driven growth and corporate earnings. This alignment between structure and sentiment reinforces the strength of the current trend.
What’s especially encouraging is how the price has remained in the upper half of the ascending channel. Every corrective move has been shallow and absorbed quickly as well. This kind of behavior is exactly what you want to see in a strong trend.
From a structural perspective, the recent break of the prior swing high confirmed a bullish break of structure (BOS), reinforcing the broader uptrend. That’s a meaningful move, not just technically, but also psychologically, as it validates that bullish momentum remains intact and market participants are still positioning for higher levels.
No signs of weakness are showing up yet. If anything, the structure is intact and there’s no evidence of a shift in momentum. This makes it a good opportunity for traders who are "late to the party" to consider entering, as the trend still looks strong and continuation is likely.
As for upside targets, the 23,000 level is a natural extension. It aligns with the middle of the channel and fits within the current rate of expansion. If we don’t see any warning signs (like impulsive bearish candles), this target remains both technically justified and psychologically relevant.
Just sharing my thoughts on support and resistance, this isn’t financial advice. Always confirm your setups and manage your risk properly.
Disclosure: I am part of Trade Nation's Influencer program and receive a monthly fee for using their TradingView charts in my analysis.