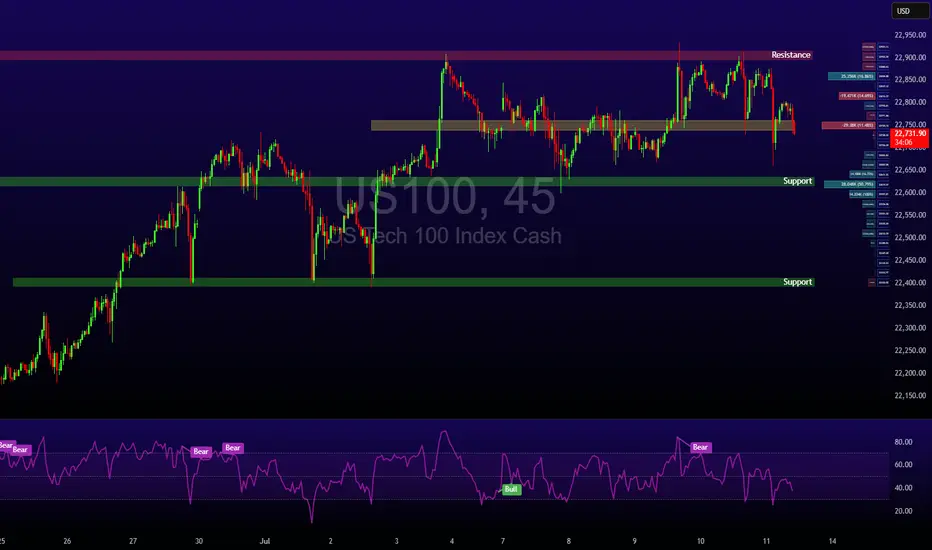
US100 Will Go Down!
HI,Traders !
#US100 made a retest
Of the wide horizontal
Resistance around 22688.6
And we are already seeing a
Local bearish reaction so
We will be expecting a
Further bearish move down !
Comment and subscribe to help us grow !
NAS100 trade ideas

Nasdaq shortI think it is time to take the lows on the lower time frame.
Time for a small reversal.
1min entry and bos .

Up Up Up... Nothing Can Stop NAS From RisingLet's take a look at the big picture in the NASDAQ: Do you see how nicely the spring crash landed on the 50% retracement of the upward movement since fall 2022?
Now that we've crossed the old ATH, the targets are clear, and they're way up in the NASDAQ.
The summer correction is therefore likely to fail and probably turn into a listless sideways slide. By September at the latest, however, the NAS should pick up speed again and head for targets between 25,000 and 26,000 - at the very least.
Clear skies!

US100 POSSIBLE SELL OPPORTUNITY!!We’re going to see a possible sell opportunity on US100 from the current market price. SL 22594 take profit at 22178

NSDQ100 lower after ADP Employment shrank to 33K in JuneTrump Trade Tensions:
Donald Trump reaffirmed his July 9 deadline for higher tariffs, intensifying criticism of Japan, particularly over auto sector issues. While Japan insists talks are in good faith, market fears of a breakdown are rising.
US Tax Policy in Focus:
Trump’s “Big Beautiful” tax and spending bill faces potential resistance in the House despite narrowly passing the Senate. The proposal’s scale and political friction are drawing investor attention.
Apple Supply Chain Worry:
Foxconn has pulled hundreds of Chinese staff from its Indian iPhone factories, sparking fresh concerns about Apple’s supply chain and Wall Street’s potentially overheated tech optimism.
Paramount Settlement:
Paramount resolved a lawsuit with Trump over alleged election interference via CBS’s coverage. Meanwhile, the company awaits FCC approval for its Skydance merger.
Auto Sector Weakness:
Stellantis reported a 10% drop in U.S. Q2 deliveries despite some brand gains. Tesla is expected to post a 12% annual decline in vehicle deliveries, reinforcing signs of cooling demand in the sector.
Conclusion:
Markets remain cautious but resilient amid political tensions, supply chain disruptions, and weaker auto sales. Attention is now turning to upcoming trade deadlines, policy decisions, and Q2 corporate results.
Key Support and Resistance Levels
Resistance Level 1: 22710
Resistance Level 2: 22820
Resistance Level 3: 22930
Support Level 1: 22190
Support Level 2: 22040
Support Level 3: 21900
This communication is for informational purposes only and should not be viewed as any form of recommendation as to a particular course of action or as investment advice. It is not intended as an offer or solicitation for the purchase or sale of any financial instrument or as an official confirmation of any transaction. Opinions, estimates and assumptions expressed herein are made as of the date of this communication and are subject to change without notice. This communication has been prepared based upon information, including market prices, data and other information, believed to be reliable; however, Trade Nation does not warrant its completeness or accuracy. All market prices and market data contained in or attached to this communication are indicative and subject to change without notice.

US100 update market The chart you've shared is a 2-hour timeframe for the US 100 index (NASDAQ 100) with a clear bearish outlook marked by projected price levels and potential demand zones.
Key Observations:
1. Current Price:
22,478.5 (near-term consolidation with recent bearish pressure)
2. Highlighted Zones:
Resistance Zone: Around 22,750–22,800 — where price previously reversed.
First Demand Zone: Around 22,100–22,200 — potential support.
Second Demand Zone: Around 21,500–21,600 — deeper support level.
Third Major Demand Zone: Near 21,200 — long-term support.
3. Bearish Structure:
Price has broken below recent support levels.
Black dotted line shows a projected move toward lower demand zones.
Momentum appears to be weakening after a strong bullish rally from June 21–28.
4. Technical Bias:
This is a bearish correction or possible trend reversal setup.
The presence of strong demand zones suggests potential bounce zones if price reaches those levels.
---
Summary:
This chart implies a bearish move is underway on the US 100 with expected targets near 22,100, then 21,600, and potentially 21,200. Watch for bullish reaction or reversal signals at those zones. If price reclaims 22,800+, bearish outlook would be invalidated.
Let me know if you want a trade setup or confirmation strategy based on this analysis.

Tesla Drop Pressures Nasdaq – 22,470 Key to Hold RecoveryUSNAS100 | Overview
Tesla dropped approximately 5%, weighing heavily on the Nasdaq, amid public tensions between Elon Musk and Donald Trump.
Yesterday, the price declined below 22,610 due to the impact of Tesla’s fall but remained above 22,470. As long as it trades above this level, a recovery attempt is likely, with the price expected to break through the consolidation zone between 22,615 and 22,740.
However, if the 1h candle closes below 22,470, the bearish trend is expected to continue toward 22,280 and potentially lower.
Pivot: 22,470
Resistance: 22,615 – 22,740 –23,000
Support: 22,280 – 22,200

NAS100 Potential ReversalHi there,
The NAS100 is slightly bullish and fairly stagnant. It is consolidating between two key levels (orange lines). A break below the price might fall into deeper demand zones.
Short Notes
- **Elliott Wave**: 5-wave structure appears complete at resistance (22,137.8), signalling a possible reversal.
- **Liquidity Zones**: Price is at/near a major liquidity zone, increasing reversal risk.
- **Break High**: There's a potential for a false breakout above wave 5 before dropping.
- **Support Levels**: The 21,800.6 (previous day high) and 21,146.2 (previous day low) for first support.
- **Demand Zones**: Strong demand below 21,146.2, with deeper support near 20,000 and 18,800.
- **Overview: A possible bearish move ahead from current highs, targeting lower demand zones.
Happy Trading,
K.
Not trading advice

US100Price broke daily resistance last week and now looks like a retracement is on the way. H4 gave a double top at the rising channel resistance. Pulling back to retest the neckline. target is 22,200.

USNAS100 Bullish Momentum Holds Above Key PivotUSNAS100 – Overview
The price successfully retested the 22,610 level and resumed its bullish trend, reaching 22,750 as anticipated in our previous idea.
Currently, the index needs to maintain stability above the 22,610 pivot line to sustain the upward momentum toward the next resistance at 22,790. A sustained move above this level may open the path toward 23,000.
However, a 1H candle close below 22,610 could trigger a corrective move down to 22,480. A break below this support would expose the next key level at 22,280.
Pivot: 22,610
Resistance: 22,790 – 23,000
Support: 22,480 – 22,280

NAS100 Forecast 24HAs of Tuesday, July 15, 2025, 2:03:11 AM UTC+4 the forecast for US100 (Nasdaq 100) in the next 24 hours presents a mixed outlook, with underlying bullish sentiment but caution due to ongoing market dynamics and potential for short-term pullbacks.
Factors Contributing to a Bullish Bias:
Underlying Strength and Breakout Behavior: Despite some short-term bearish technical signals, the Nasdaq is described as being in "breakout mode," decisively overriding key levels. This suggests underlying bullish momentum.
AI as a Growth Driver: Artificial intelligence (AI) remains a primary growth driver for the US economy and the technology sector, which heavily influences the Nasdaq 100. Confidence in secular tailwinds like cloud computing and semiconductor demand also persists .
Temporary US Dollar Weakness: The US Dollar Index (DXY) is currently in a retracement phase, pulling back after strength. A weaker dollar can provide a relief rally for risk assets like the Nasdaq, making US tech stocks more attractive to international investors.
Potential for Federal Reserve Rate Cuts: While no rate cuts are expected over the summer, a rate cut is considered likely in September. Historically, phases of moderate interest rate cuts in the absence of a recession have been positive for the US stock market.
"Buy on Dip" Mentality: Some analyses suggest that any short-term declines could be viewed as buying opportunities, indicating an underlying positive sentiment among investors.
Strong Earnings Expectations (for some tech): Despite general market concerns, some technology companies associated with AI innovation are expected to perform well, contributing positively to the index.
Factors Suggesting Caution and Potential for Bearish Movement/Volatility:
Escalating Trade Tensions (Trump's Tariffs): President Trump's continued aggressive protectionist stance and new tariff threats (e.g., against Canada) are a significant risk. These can create uncertainty, weigh on corporate profits, and lead to market volatility. This is frequently cited as the main risk for US indices.
Short-Term Technical Bearishness: Some technical analyses indicate a high chance of bearish candle closures across various timeframes (1H, 4H, Daily, Weekly, Monthly) , and some traders are eyeing selling opportunities from specific resistance zones (e.g., around 22,800-22,869).
Overvalued Growth Stocks: Following a recent rally, US stocks, particularly growth stocks, are trading at a premium to fair value. This can limit upside potential and make the market more susceptible to corrections if tariff negotiations falter or earnings guidance disappoints.
Market Seasonality: As we move into the latter half of July, market seasonality can shift from bullish to a more bearish stance.
Earnings Season and "Sell on the News" : While major financial institutions are kicking off Q2 earnings season, there's a potential for a "sell on the news" response, even if earnings aren't particularly bad, given the strong rally stocks have already staged.
Mixed Global Signals: European markets showing mixed performance and pressure from US futures suggest cautious global risk sentiment, which could cap upside for the Nasdaq.
Unfilled Stock Imbalances: Some technical analysis points to an unfilled stock imbalance around 22,300, which could act as a reaction point if the price pulls back.
Key Levels to Watch (Approximate):
Support: 22,600, 22,300 (unfilled imbalance), 21,611 (resistance-turned-support), 20,673 (Fibonacci extension and prior high).
Resistance: 22,800, 22,869, 23,000-23,100 (potential re-entry targets for rally continuation), 25,000-25,100 (approximate imbalance level to be filled).
In conclusion, for the next 24 hours, the US100 is likely to face a battle between underlying bullish momentum driven by AI and potential Fed policy, and the immediate headwinds of escalating trade tensions and some short-term technical bearishness. Traders should be prepared for volatility and quick shifts in sentiment based on news flow, particularly regarding trade and upcoming earnings reports.
For those interested in further developing their trading skills based on these types of analyses, consider exploring the mentoring program offered by Shunya Trade.
I welcome your feedback on this analysis, as it will inform and enhance my future work.
Regards,
Shunya Trade
⚠️ Disclaimer: This post is educational content and does not constitute investment advice, financial advice, or trading recommendations. The views expressed here are based on technical analysis and are shared solely for informational purposes. The stock market is subject to risks, including capital loss, and readers should exercise due diligence before investing. We do not take responsibility for decisions made based on this content. Consult a certified financial advisor for personalized guidance.

NAS100 formed a bullish Flag Wait for Breakout NAS100 has recently formed a Flag pattern and price is currently consolidating in the flag channel(box) pattern and wait for the breakout can easily take the price to 23500-23600.

NAS100/US100 Short Swing Trade for week Risking 1% to make 2%PEPPERSTONE:NAS100 / CAPITALCOM:US100 Short trade for week - its swing trade, with my back testing of this strategy, it hits multiple possible take profits, manage your position accordingly.
This is good trade, don't overload your risk like greedy, be disciplined trader, this is good trade.
Use proper risk management
Looks like good trade.
Lets monitor.
Use proper risk management.
Disclaimer: only idea, not advice


NAS100 - Stock market awaits inflation!The index is located between EMA200 and EMA50 on the one-hour timeframe and is trading in its ascending channel. Maintaining the ascending channel and confirming it after breaking the downtrend line will lead to the continuation of the Nasdaq's upward path to higher targets (23000), but in case of no increase and channel failure, one can look for selling positions up to the target of 22500.
Last week, the U.S.dollar demonstrated strong performance against major global currencies, despite having experienced some weakness since April 2, when President Donald Trump announced retaliatory tariffs against key U.S. trading partners. However, these tariffs were ultimately postponed, and only a baseline 10% tariff was maintained.
The 90-day deadline for implementing these tariffs, originally set to expire on Wednesday, has now been extended to August 1. Nevertheless, Trump surprised the markets this week by announcing a 25% tariff on imports from Japan and South Korea, threatening a 50% tariff on Brazilian goods, and implementing lower tariffs for other partners. These developments triggered a shift of capital toward the U.S. dollar as a safe-haven asset, boosting its strength.
This marks a notable shift in how the dollar is reacting to tariff tensions. In April, fears of an economic slowdown weighed on the greenback, but now it is gaining traction as a refuge in times of uncertainty, particularly as inflation risks mount—contributing to choppy moves in U.S. equity markets.
As is customary, the earnings season will kick off with reports from major banks and financial institutions. On Tuesday, JPMorgan is set to release its financial results, opening the floodgates for a wave of earnings reports. The image referenced lists several other companies, many of which are market heavyweights.
Following a relatively quiet week due to Independence Day holidays and a lack of major economic data, markets are now gearing up for a steady stream of reports in the coming days. Tuesday will bring the Consumer Price Index (CPI) for June along with the Empire State manufacturing survey. On Wednesday, the spotlight will shift to the Producer Price Index (PPI) for the same month. Then, on Thursday, traders will focus on June’s retail sales report, the Philadelphia Fed’s manufacturing survey, and the weekly jobless claims figures.
The week will conclude with two additional reports on Friday: the June housing starts data and the preliminary reading of the University of Michigan’s Consumer Sentiment Index.
June’s CPI report is expected to reflect an uptick in inflation, potentially driven by Trump’s tariff policies. Some analysts believe the tariffs will have an “undeniable” impact on prices, though others remain uncertain.
Despite concerns from both experts and consumers that businesses might pass tariff costs on to buyers, inflation has so far remained relatively moderate this year. The effects of Trump’s aggressive tariff campaign on hard economic data have not yet been clearly reflected—but that may be about to change.
According to Bloomberg’s consensus forecasts, as cited by Wells Fargo Securities, the CPI is expected to show a 2.7% year-over-year increase in June—up from 2.4% the previous month. Meanwhile, core CPI, which excludes volatile food and energy prices, is projected to have risen 3% over the same period, compared to a prior gain of 2.8%.
If these numbers come in as expected, it could support the forecasts of analysts who have warned that the costs of Trump’s heavy import tariffs would eventually show up on price tags, as manufacturers, importers, and retailers pass along the burden through the supply chain. Since taking office, Trump has imposed a wide array of tariffs, including a 10% levy on most imports, a 25% duty on foreign automobiles, and tariffs exceeding 50% on Chinese products.

NASDAQ - Long Bias explanation and Entry/SL/TP ideasTrend : NASDAQ is in a strong uptrend at the moment
Retail : Majority have a BEARISH sentiment on this pair
Institutions : Increase in week over week holdings
Structures : No structures as we are at highs so targeting recent formed high + round number above makes sense
Price action : Sitting on a support shelf at the moment
Targets : Recent high + level at round number (23000)
Stops : Many options to place stops below
Entries : Positive bounce at current level, decent entry zone but further possible entry levels sit below too
If trading on a shorter timeframe, perhaps the gap fill is a good point to take the trade off the table.
Targeting higher than 23 might be dangerous as we are playing around at ATHs

NASDAQ - BUYS📉➡️📈 USTEC 15min – Precision Long After Panic Drop
🎯 Reversal Detected | No Hesitation | Immediate Follow-Through
Markets don’t always give second chances. But when they do — you want to be ready.
This sharp drop on USTEC (NASDAQ 100) looked brutal to most...
But the ELFIEDT RSI + Reversion indicator calmly printed a double UP signal at the exact low.
🟢 The Signal: Two “UP” Prints at the Bottom
After a fast and aggressive drop, the system triggered two stacked UP signals right into the final selloff candle — giving clear guidance for a high-probability reversal.
🔹 Hypothetical Trade Setup:
Entry: On confirmation of the second UP signal
Stop-loss: Below the signal wick (minimal drawdown)
Reward: Price surged immediately, offering a strong rally of over 100 points in minutes
⏱️ No delay. No doubt.
✅ Traders were positioned before the herd caught on.
🧠 What Makes ELFIEDT Different?
This isn’t about standard indicators.
This is exhaustion logic fused with a proprietary RSI-based reversion model that works across indices, FX, metals, and more.
📌 Non-repainting
📌 Context-aware
📌 Built for real entries, not just “nice charts”
🔐 This is the public build.
The private builds include even more firepower:
Multi-timeframe confluence
Smart volatility filters
Divergence overlays
Breakout-retest logic
Institutional grade scalping layers
📩 DM to request access — limited spots, serious traders only.
#NASDAQ #USTEC #ReversalTrading #SmartSignals #ELFIEDT #RSIBounce #15MinStrategy #TradingView #Indices #Tech100

are we going ath? let us now~~indices looks green, so we rally?
no trump tariffs?
🐉We value full transparency. All wins and fails fully publicized, zero edit, zero delete, zero fakes.🐉
🐉Check out our socials for some nice insights.🐉
information created and published doesn't constitute investment advice!
NOT financial advice

Nasdaq 100 Dips as Tariffs Spark CautionWhile crypto markets rally, U.S. equities have cooled. The Nasdaq 100 dropped by 0.6% following the announcement of new tariffs, particularly those aimed at Canadian goods. Tech stocks are reacting cautiously to these developments, although Nvidia’s record-breaking $4 trillion market cap continues to provide some support for the index.
With major financials such as JPMorgan and Wells Fargo reporting Q2 earnings next week, investors will soon get clarity on how corporate America is coping with higher input costs and global trade tensions.
Technical View (Nasdaq 100):
The index is consolidating between resistance at 22,900 and support at 22,600. A break above 22,900 could reignite the tech rally, while a drop below support may see price test 22,400 and potentially 22,000 in coming sessions.
NAS100 - Follow Progress 2Dear Friends in Trading,
How I see it,
I have summarized the progress and indicated all key levels
Keynotes:
1) I am starting to see strong quality red candles.
2) 22867 is a VERY strong Internal resistance level at this time.
3) 22725 is a VERY strong Internal support level at this time.
I'll keep you posted...please ask if anything is unclear.
I sincerely hope my point of view offers a valued insight.
Thank you for taking the time to study my analysis.

Nasdaq leads the rally and can move for 3-5 days moreWhile crude oil is declining, tech stocks are gaining momentum: Nasdaq had reached another all-time-high recently and that might not be over: according to statistical studies, it rarely reverses quickly above the upper Bollinger Bands line and the average swing duration is between 17 and 20 days (which gives us several days of potential continuation).
The earnings season fuels growth for many technological stocks, and the “sell America” narrative steps back, so we may see Nasdaq growing as shown in the chart below.
Don't forget - this is just the idea, always do your own reserch and never forget to manage your risk!

The W FormationThe question now is, with the W pattern forming with bold bullish price, that has broken a high we had as a target yesterday, tapped on the FVG already and now showing some positive candle stick communication, will we buy to continue breaking the highs, or relax and wait for more confirmation within the fvg range or even lower before going in?

NAS100 Reading Market Structure: When to Trade and When to WaitI'm currently keeping a close eye on the NASDAQ 📉. Price has remained largely range-bound over the past few sessions and continues to show signs of pressure 🔻. While we've seen a short-term rally 🚀, it lacks the conviction and momentum typically seen in stronger trending environments 📊.
When comparing the current conditions to previous trend phases, the difference is clear. Structure is unclear, and there's no confirmation of sustained direction yet. As shown on the chart 📈, we previously saw strong bullish momentum followed by a sharp shift, suggesting indecision in the market 🤔.
In these situations, patience is key ⏳. It's just as important to know when not to trade as it is to know when to act 🎯. For now, I’m choosing to stay on the sidelines until a clearer trend develops.
Not financial advice ⚠️
