Nasdaq 100 Near Breakout – Eyes on 22,200 ResistanceThe Nasdaq 100 is approaching a critical technical level at 22,200. This resistance marks the upper boundary of recent consolidation and aligns with prior rejection zones. A clean break above this threshold could trigger a sharp upside move, possibly propelling the index into uncharted territory.
Geopolitical tensions have eased, and the dollar’s renewed weakness is supporting risk appetite, particularly in the tech-heavy Nasdaq. Strong earnings from key sectors are reinforcing bullish sentiment, with investors increasingly pricing in a favorable macro backdrop.
Technically, momentum is building. Price action has formed a series of higher lows, and buying pressure is intensifying near resistance. A breakout above 22,200 could ignite a strong rally, driven by stop orders and fresh bullish entries.
That said, traders should remain cautious. While the breakout setup is promising, a retracement toward support zones—such as 21,500 or the 20-day moving average—remains possible, especially if upcoming inflation or macro data disappoints.
For now, the 22,200 level remains the key to watch. A daily close above this level would shift the bias clearly higher, confirming breakout strength and potentially accelerating gains toward 22,800 or beyond.
NAS100 trade ideas

XAUUSD
🚨 Smart Money Sniper Signal – XAU/USD (Gold)
🕒 Timeframe: M15 or H1
📅 Date: June 25, 2025
---
🔍 Market Context
Current price: ~$3,326
Market structure: Bullish on H1
Liquidity grab zone: Observed around $3,322
Order block support: $3,318 – $3,322
RSI: Above 50 (bullish momentum)
---
🟢 Buy Setup (Sniper Entry)
Entry zone: $3,322 – $3,324 (on bullish confirmation)
Confirmation: Bullish engulfing or strong bullish candle on M15
Stop Loss: Below $3,318
Take Profit targets:
TP1: $3,330
TP2: $3,336
TP3: $3,344
🧠 Tip: Use a Risk:Reward ratio of at least 1:2. Set trailing stop once TP1 is reached.
---
🔴 Sell Scenario (If invalidation)
If price breaks below $3,318 with volume:
→ Wait for a retest of the zone and enter SELL
TP1: $3,312
TP2: $3,304
---
🔔 For TalionPromosal (TradingView page)
Use this caption for your idea post:
> 💥 Smart Money Signal (Gold – M15/H1)
Bullish structure still valid. Looking for sniper entry near $3,322 with OB + RSI confluence.
SL below $3,318. TP targets $3,330 / $3,336 / $3,344.
Risk-managed & institutionally aligned setup.
#SmartMoney #XAUUSD #Gold #SniperEntry #TalionPromosal #TradingView

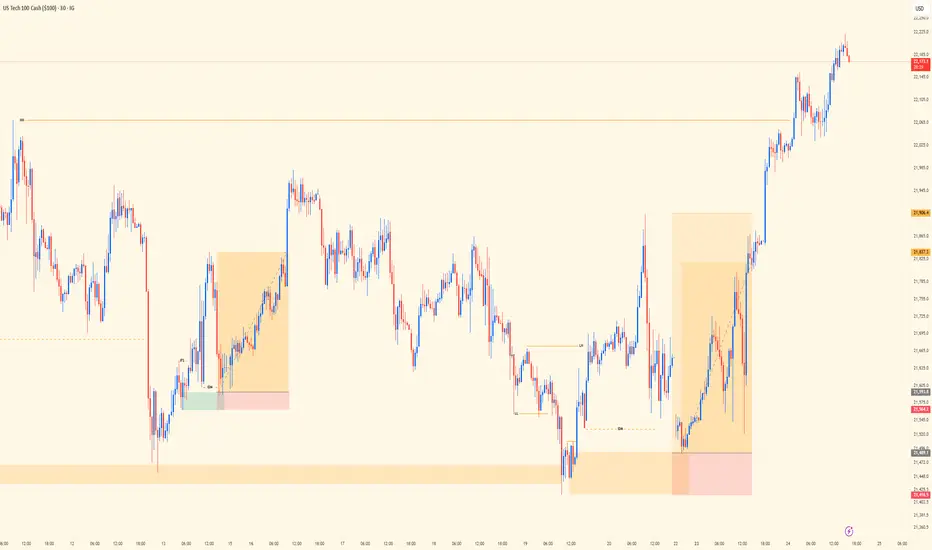
NASDAQ Midweek Review | Trend, Liquidity, PrecisionSingle-chart post today showing the execution trail behind two solid wins on NASDAQ.
Top-down bias was aligned — bulls clearly in control, so I stuck with trend direction. No need to fight momentum. As a trend trader, I don’t counter — that mindset shift alone is what keeps me consistent and clean with entries.
Chart shows the 30M view — where structure, liquidity, and timing came together. Both setups were built off elite structure reads. Liquidity played its part: manipulation, sweep, confirmation, and execution.
Bias: Bullish
HTF Alignment: Bullish trend continuation
Entry Frame: 30M precision
Key Insight: Liquidity isn’t noise — it’s narrative.
Mindset Note: Counter-trading is a shortcut to inconsistency. Stay with flow, respect structure.
Bless Trading!
Nasdaq Surges on Ceasefire Hopes – New All-Time Highs Ahead?By analyzing the #Nasdaq chart on the weekly timeframe, we can see that the index experienced a strong rally following the ceasefire announcement between Iran and Israel, climbing as high as 22,200 so far. If the ceasefire holds and tensions continue to ease, we could see a new all-time high for the Nasdaq.
Potential bullish targets for this move are 22,400, 23,200, and 24,000.
Please support me with your likes and comments to motivate me to share more analysis with you and share your opinion about the possible trend of this chart with me !
Best Regards , Arman Shaban

Nasdaq: Bull flag breakout on daily chart, testing ATHsBeen a while since I last posted. So figured I'd share this quick chart. Market undoubtedly have been incredibly volatile this month. However luckily, the Nasdaq has been forming bull flag on the daily chart. This follows a strong prior uptrend. The breakout took place today, sending the index to test ATHs.
Notable stocks making a move are names like NASDAQ:AMZN and NASDAQ:NVDA , mainly due to the broader market strength. Other indices, such as the S&P 500 ( SP:SPX ) also are breaking out as they form a similar bull flag pattern.
At ATHs, this is a deciding factor of where the market goes next. Either it bounces off to near-term support, or the market rallies to a new all-time high until next cooldown.
Note: not financial advice

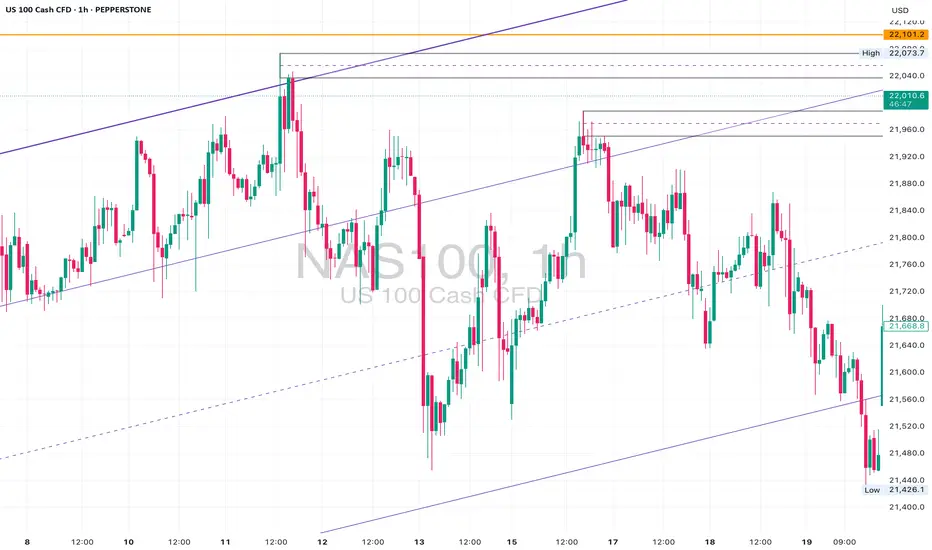
USNAS100 Technical Setup: Watching 21635 and 21835 LevelsUSNAS100 – Technical Outlook
The price has stabilized above the key pivot level at 21635, indicating potential short-term upside toward the resistance at 21835.
However, as long as the price trades below 21835, the broader bias remains bearish. A confirmed 1H close below 21635 would reintroduce downside pressure, targeting 21470 and potentially extending toward 21375 and 21250.
Pivot Level: 21635
Support: 21470, 21375, 21250
Resistance: 21835, 21930, 22090
previous idea:

Nasdaq shortAiming for asian lows.
let us see if there is at least a small pullback .
1:2 risk reward ratio.

MAOR HEAD N SHOULDER TOP FORMATION I AM 100 % SHORT NOW The chart posted is that on the NDX 100 .This is my view of what has formed . best of trades WAVETIMER

Bullish IdeaExplained on graph. I justify the bull using OB and FVG and sweeps of Liquidity from London lows, if all aligns I will take this trade.

NAS100 SHORTElite Live Analysis
Market Structure: Bullish across the Weekly, Daily, and 4H timeframes.
Key Level: Price has reached a significant zone where a potential reversal is expected.
Confirmation: Transitional switch confirmed on the 1-Min, 3-Min, and 5-Min timeframes.
Execution: Entry based on the 5-Min confirmation.
Targets:
Structured liquidity levels
Lower liquidity pools resting beneath current price

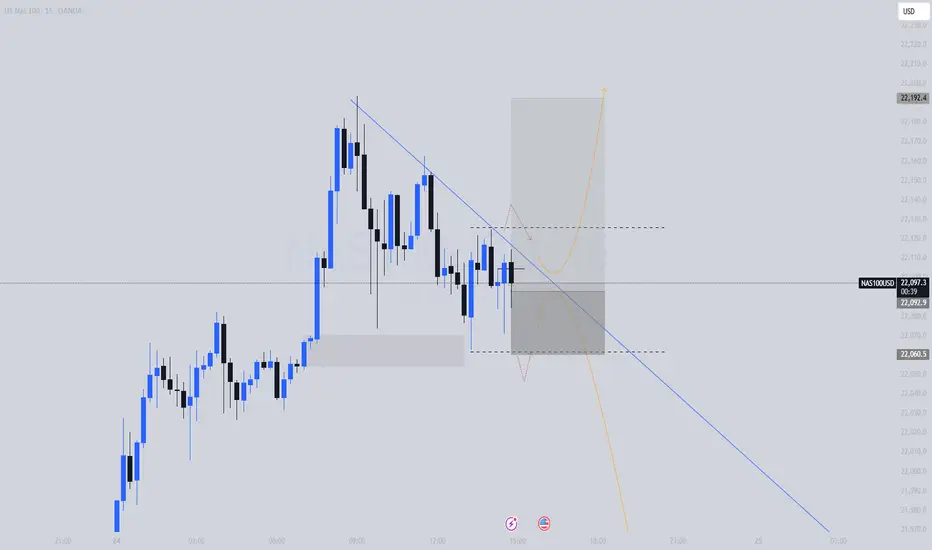
NAS100 | 15min | Breakout or Breakdown SetupPrice is currently testing the descending trendline and a key demand zone after a short-term selloff. Entry taken at a possible liquidity grab with bullish intent, targeting a breakout above the trendline. If rejection continues, a drop towards the lower liquidity area near 22,060 is likely. Watching for confirmation on the next 1–2 candles.
NAS100 | LTF viewpointWe are currently caught between 2 LQC candles that have both swept LQ and we are waiting for the break of the trend to the upside as we have tapped into to 68 & 72% fib levels
So the is a high chance we continue to the upside with NASDAQ BUT if market decides to disregard that setup o9f UPSIDE momentum the is a chance of sellers stepping into the market only if of LQC(liquidity swept candle) decides to not hold then we can begin looking for SELLING OPPORTUNITIES
FEEL FREE TO DROP A FEW ADVICES IN THE COMMENT SECTION IF YOU HAVE SOMETHING SIMILAR THAT SUPPORTS MY ANALYSIS OR IF YOU ARE SEEING SOMETHING DIFFERENT

NASDAQ, USTECUSTEC price is currently near the main resistance level of 22168-22229. If the price cannot break through the level of 22229, it is expected that the price will have a chance to go down. Consider selling the red zone.
🔥Trading futures, forex, CFDs and stocks carries a risk of loss.
Please consider carefully whether such trading is suitable for you.
>>GooD Luck 😊
❤️ Like and subscribe to never miss a new idea!

USTECH Long opportunity USTECH is currently on a bullish impulse move, sitting at the resistance level of 22,000. price is trading above the 50 SMA and we can see momentum favors the bulls with the RSI above the 55 level
Expecting a drop in price, based on the technical analysis, where we could potentially see a retest of of the 21,800 price level before the bullish trend resumes beyond 22,000.
Fundamentals with the Iran Israel cease fire support further bullish indices with confidence coming back into the markets.

NAS Might Drop Due to Middle East TensionsWild times, eh?
In the midst of a new war in the Middle East, the NASDAQ (like most other indices) is bursting with symbolic strength.
Will it do well? One may doubt it.
Here is a short idea with a conservative target, supported by clearly bearish RSI divergences.

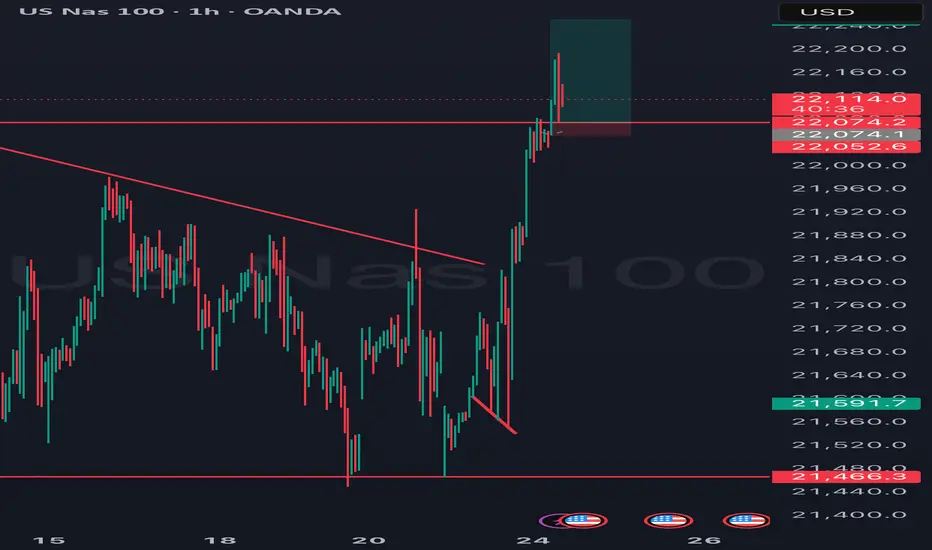
Buy NasAfter breaking the recent H4 resistance we hoping that Nas is reaching for the Daily higher high and probably breaking it.
NAS100I am looking for selling opportunities for NAS100. The market is very volatile, so trade with caution. Currently, it is trading in a seller-friendly zone, which suggests that we may see an influx of sellers. This should represent a 5/6 Fibonacci retracement, with the potential for a further decline over a longer time frame. However, please note that my sell analysis for NAS has not been very accurate in the past. While I’ve been able to collect a few pips, the broader movements have aligned better.

Can Geopolitics Power Tech's Ascent?The Nasdaq index recently experienced a significant surge, driven largely by an unexpected de-escalation of tensions between Israel and Iran. Following a weekend where U.S. forces reportedly attacked Iranian nuclear sites, investors braced for a volatile Monday. However, Iran's measured response - a missile strike on a U.S. base in Qatar, notably without casualties or significant damage - signaled a clear intent to avoid wider conflict. This pivotal moment culminated in President Trump's announcement of a "Complete and Total CEASEFIRE" on Truth Social, which immediately sent U.S. stock futures, including the Nasdaq, soaring. This rapid shift from geopolitical brinkmanship to a declared truce fundamentally altered risk perceptions, alleviating immediate concerns that had weighed on global markets.
This geopolitical calm proved particularly beneficial for the Nasdaq, an index heavily weighted towards technology and growth stocks. These companies, often characterized by global supply chains and reliance on stable international markets, thrive in environments of reduced uncertainty. Unlike sectors tied to commodity prices, tech firms derive their value from innovation, data, and software assets, which are less susceptible to direct geopolitical disruptions when tensions ease. The perceived de-escalation of conflict not only boosted investor confidence in these growth-oriented companies but also potentially reduced pressure on the Federal Reserve regarding future monetary policy, a factor that profoundly impacts the borrowing costs and valuations of high-growth technology firms.
Beyond the immediate geopolitical relief, other crucial factors are shaping the market's trajectory. Federal Reserve Chair Jerome Powell's upcoming testimony before the House Financial Services Committee, where he will discuss monetary policy, remains a key focus. Investors are closely scrutinizing his remarks for any indications regarding future interest rate adjustments, particularly given current expectations for potential rate cuts in 2025. Additionally, significant corporate earnings reports from major companies like Carnival Corporation (CCL), FedEx (FDX), and BlackBerry (BB) are due. These reports will offer vital insights into various sectors' health, providing a more granular understanding of consumer spending, global logistics, and software security, thereby influencing overall market sentiment and the Nasdaq's continued performance.

"History repeats itself, first as tragedy, second as farce"CAPITALCOM:US100 How do you call it when price makes a HH but its RSI doesn't follow? And what is going to happen after that?

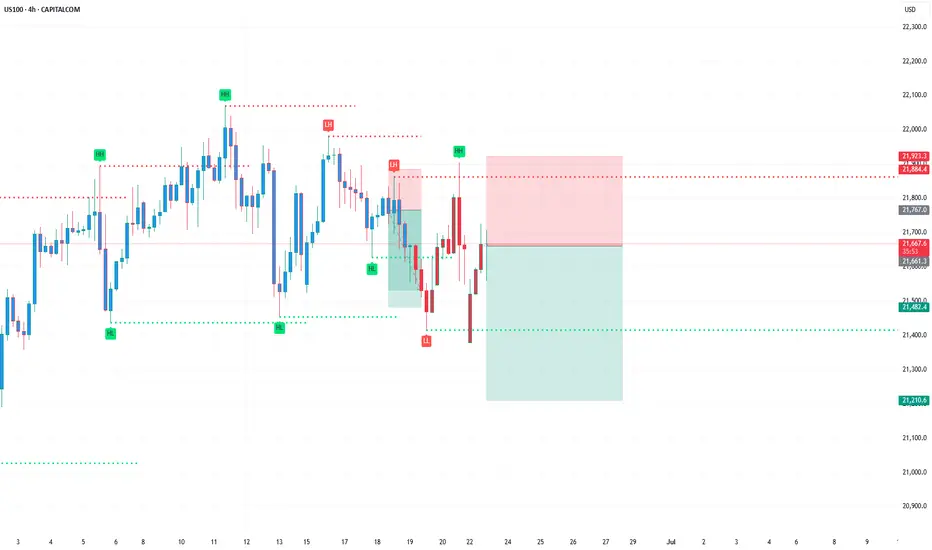
Market Structure Breakdown on NASDAQ: What Traders Should Watch📉 NASDAQ (NAS100, US100) Analysis 🧠💼
I’m currently keeping a close eye on the NASDAQ (NAS100) — price action is telling a story worth watching.
📆 Last week, the index came under clear pressure, and now on the 4H timeframe, we’re seeing a defined bearish structure with consistent lower highs and lower lows 📉🔻. This recent expansion to the downside has led to a break in market structure (BOS), and price is now pulling back into equilibrium 🔄.
⏳ For now, it’s a waiting game. I’m watching to see if this pullback finds resistance at a premium level and rotates back to the downside, which would present a potential short setup 🎯📊.
🕒 On the 30-minute chart, I’m monitoring for a clear structural shift — a change in momentum that confirms bearish intent. Should the NASDAQ resume its downward move, it could trigger risk-off sentiment, bringing strength into the JPY pairs 💴🚨 as capital flows out of risk assets.
⚠️ Disclaimer:
This analysis is for educational purposes only and should not be considered financial advice. Always conduct your own research and consult with a licensed financial advisor before making any trading decisions. 📚💼

NAS100 Analysis – Structure Breakout or Trap?📍 Levels Marked: 22,101 Resistance | 21,880 Mid-Level | 21,375 Channel Support
⸻
📊 Technical Breakdown:
The NAS100 has surged into the 22,000+ range, breaking above the mid-level channel boundary after consolidating beneath it for days. This breakout takes us right back into an untested supply zone from March.
On the lower timeframes (1H & 23min), price cleanly cleared multiple lower highs with aggressive bullish momentum, printing a new intraday high at 22,015. However, structure is still trapped inside a long-term ascending channel on the 4H and D1 — and this move could be setting up a liquidity grab before reversal.
Key zone to watch:
• 22,101 – 22,200 (daily resistance + equal highs)
• 21,880 – 21,920 (possible retest zone)
• 21,375 (channel base support)
⸻
📉 Trade Ideas:
• Short Bias if price rejects the 22,100–22,200 area with bearish confirmation on lower timeframes. Target: 21,800 – 21,600.
• Long Bias only if price gives a bullish retest of the 21,880–21,920 zone with clean structure. Target: 22,222+ with tight risk.
⸻
💡 Final Thoughts:
A textbook case of a channel edge breakout — but breakout or fakeout? Always wait for confirmation and let structure guide the setup. We’re either about to print new highs or see a sharp correction.
📌 Mark your levels. Watch the retest. Execute with confidence.
US100 / NASDAQ TodayUS100 Today is still bearish
My SSM structure is still down
I'm waiting to open US and looking good entry