USD/JPY Bearish Flag (30.06.2025)The USD/JPY Pair on the M30 timeframe presents a Potential Selling Opportunity due to a recent Formation of a Bearish Flag Breakout Pattern. This suggests a shift in momentum towards the downside in the coming hours.
Possible Short Trade:
Entry: Consider Entering A Short Position around Trendl
About U.S. Dollar / Japanese Yen
Also known as trading the “gopher” the USDJPY pair is one of the most traded pairs in the world. The value of these currencies when compared to each other is affected by the interest rate differential between the Federal Reserve and the Bank of Japan.
Related currencies

USDJPY: Intraday Bearish ConfirmationLast week, I shared an update on a confirmed structure breakout for 📉USDJPY on a 4-hour chart.
On retesting the broken structure, the price showed a strong bearish signal.
I observed a rising wedge pattern with a broken support line
This breakout suggests a high likelihood that the price will d

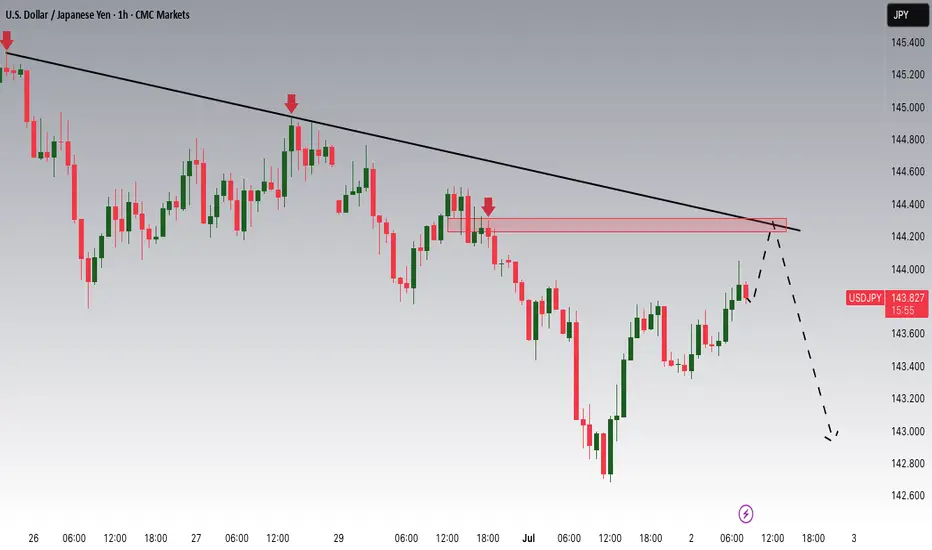
USDJPY Potential DownsidesHey Traders, in today's trading session we are monitoring USDJPY for a selling opportunity around 144.200 zone, USDJPY is trading in a downtrend and currently is in a correction phase in which it is approaching the trend at 144.200 support and resistance area.
Trade safe, Joe.
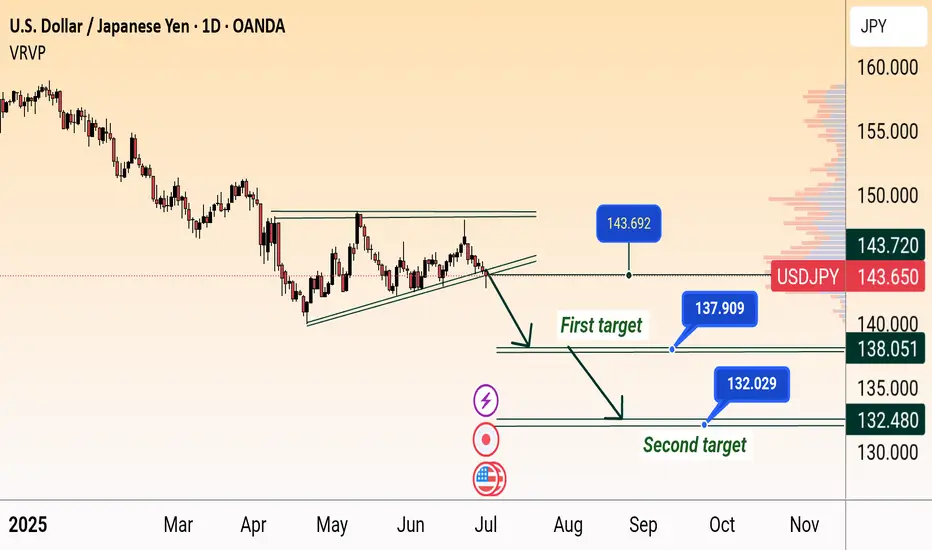
USD/JPY Bearish Breakdown Targets 138 & 132USD/JPY Bearish Breakdown Setup (Daily Chart)
USD/JPY breaks below rising wedge support near 144, signaling potential downside. Price targets are marked at 138.051 (first target) and 132.480 (second target), indicating possible continued weakness if the bearish momentum holds.
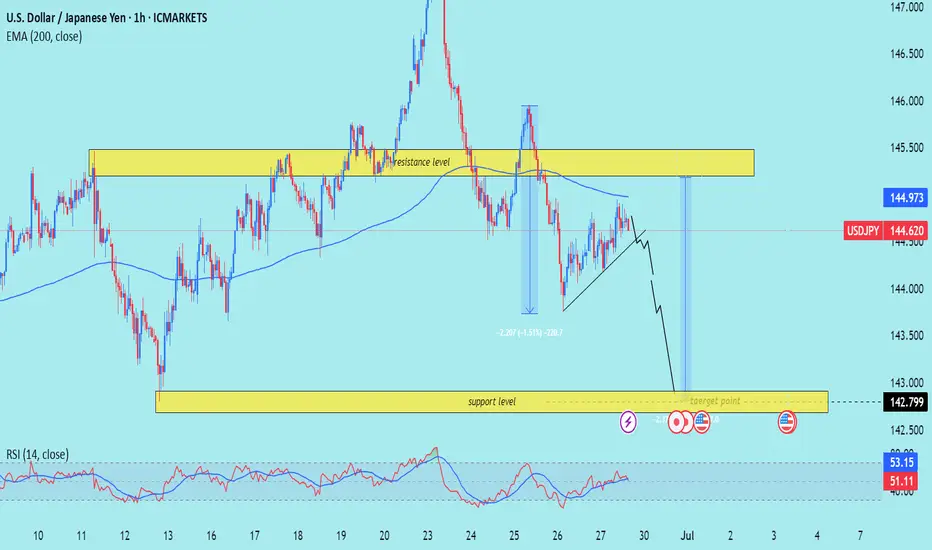
USD/JPY) bearish Trand analysis Read The captionSMC trading point update
Technical analysis of USD/JPY (U.S. Dollar vs Japanese Yen) on the 1-hour timeframe. Here's a clear breakdown of the idea presented:
---
Overview of the Setup
Current Price: 144.620
EMA 200 (Blue Line): 144.973 – price is trading below the EMA, indicating bearish
USDJPY – Key Support Bounce with Macro TailwindsUSDJPY is bouncing off a key trendline and 61.8% Fib zone (143.25–143.60) with confluence across multiple JPY crosses (EURJPY, AUDJPY, CADJPY). This area has historically triggered strong upside momentum, and the current setup aligns with both technical structure and macro drivers.
📊 Fundamentals S

#USDJPY: Price is currently accumulating ! Wait For DistributionAt present, the USDJPY currency pair appears to be in an accumulation phase, as evidenced by the absence of significant price movement throughout the current week. Several factors contribute to this trend.
Firstly, several significant economic events are scheduled for this week, particularly tomorr
USDJPY h4 strongly bullish opportunity Dip into/under support (~144.5)
2. Trap and reverse hard
3. Break above 148 with momentum
4. Stretch target → 149.50–150.20

Critical Channel Watch Begins on the 1-Hour Chart of USDJPY.Hey everyone,
📉 My Latest USDJPY Analysis:
USDJPY is currently moving within a downtrend. If the price breaks below the lower boundary of the parallel channel, our first target level will be 142.910. The most crucial factor here is the downward breakout of that channel—don’t overlook it.
Also, k

USD/JPY (4H timeframe) shows a clear break 0ut.USD/JPY (4H timeframe) shows a clear break below the ascending trendline and Ichimoku cloud support, suggesting a bearish continuation.
Key Bearish Targets (Based on the chart):
1. First Target Zone:
📉 140.88
This level aligns with previous structure support and is marked as the initial target on

See all ideas
Summarizing what the indicators are suggesting.
Oscillators
Neutral
SellBuy
Strong sellStrong buy
Strong sellSellNeutralBuyStrong buy
Oscillators
Neutral
SellBuy
Strong sellStrong buy
Strong sellSellNeutralBuyStrong buy
Summary
Neutral
SellBuy
Strong sellStrong buy
Strong sellSellNeutralBuyStrong buy
Summary
Neutral
SellBuy
Strong sellStrong buy
Strong sellSellNeutralBuyStrong buy
Summary
Neutral
SellBuy
Strong sellStrong buy
Strong sellSellNeutralBuyStrong buy
Moving Averages
Neutral
SellBuy
Strong sellStrong buy
Strong sellSellNeutralBuyStrong buy
Moving Averages
Neutral
SellBuy
Strong sellStrong buy
Strong sellSellNeutralBuyStrong buy
Displays a symbol's price movements over previous years to identify recurring trends.
Frequently Asked Questions
The current rate of USDJPY is 144.534 JPY — it has decreased by −0.11% in the past 24 hours. See more of USDJPY rate dynamics on the detailed chart.
The value of the USDJPY pair is quoted as 1 USD per x JPY. For example, if the pair is trading at 1.50, it means it takes 1.5 JPY to buy 1 USD.
The term volatility describes the risk related to the changes in an asset's value. USDJPY has the volatility rating of 0.32%. Track all currencies' changes with our live Forex Heatmap and prepare for markets volatility.
The USDJPY showed a 0.29% rise over the past week, the month change is a 0.55% rise, and over the last year it has decreased by −10.59%. Track live rate changes on the USDJPY chart.
Learn how you can make money on rate changes in numerous trading ideas created by our community.
Learn how you can make money on rate changes in numerous trading ideas created by our community.
USDJPY is a major currency pair, i.e. a popular currency paired with USD.
Currencies are usually traded through forex brokers — choose the one that suits your needs and go ahead. You can trade USDJPY right from TradingView charts — just log in to you broker account. Check out the list of our integrated brokers and find the best one for your needs and strategy.
When deciding to buy or sell currency one should keep in mind many factors including current geopolitical situation, interest rates, and other. But before plunging into a deep research, you can start with USDJPY technical analysis. The technical rating for the pair is sell today, but don't forget that markets can be very unstable, so don't stop here. According to our 1 week rating the USDJPY shows the sell signal, and 1 month rating is neutral. See more of USDJPY technicals for a more comprehensive analysis.