USDOLLAR trade ideas

USDOLLAR: NON-FARM PAYROLLS - DATA EXPECTED TO BE STUNNING ! 🔔The April U.S. jobs report partially justified the Fed's reluctance to adjust the parameters of the QE, as the economy created only 266,000 jobs and the unemployment rate rose to 6.1%. However, commodity markets continue to call out that price pressures have reached levels that pose a real danger to the economy. Frenzied inflation is hard to get under control. Last week's released CPI figure reflected a 0.8% jump in prices, while experts had predicted a 0.2% increase. And while Fed officials are confident that they can handle the pressure with monetary policy tools, there is no guarantee of that. Moreover, it is monetary and fiscal policy that fuels inflationary pressures. Twenty-two U.S. states are eliminating federal unemployment benefits.
Today, U.S. citizens are paid $300 a week in additional unemployment benefits as part of the Biden bailout package. But these payments have resulted in many Americans receiving more in benefits than they would have earned at work. Quite naturally, the desire to look for work disappears.
Such negative effects go a long way toward explaining the very contradictory statistics in the United States:
On the one hand, business activity indices are off the charts, companies are willing to hire workers and produce more.
On the other hand, unemployment rose in April compared to the previous month.
Since the beginning of March, the number of people claiming unemployment benefits for the first time has fallen by more than a third. Over the same period, the total number of people receiving benefits has fallen only 12.7%.
Non-Farm Payrolls Employment
Last data: 266K
Consensus Forecast: 650K
The Non-Farm employment change measures the change in the number of people employed during the last month in the non-farm sector. Total Non-Farm Payrolls represent about 80% of the workers who produce all of the Gross Domestic Product of the United States.
It is the most important piece of data contained in the employment report that offers the best overview of the economy.
Monthly changes and adjustments in the data can be very volatile.
Unemployment Rate
Past data: 6.1%
Consensus forecast: 5.9%
The unemployment rate measures the percentage of the total labor force that is unemployed but actively looking for a job and willing to work in the United States.
A high percentage indicates weakness in the labor market. A low percentage is positive for the U.S. labor market and should be taken as a positive factor for the USD.

Bearish Bias for the USDOLLAR IndexLooking at the US Dollar Index, it seems relatively obvious which bias has been playing out for the past year. Ever since the beginning of coronavirus, the US dollar has been weakening by the week. And there seems to be no reason to think that's going to change anytime soon. On the larger timeframes, we could see clear bearish rejection off of a significant resistance level placed on the daily timeframe. With this bearish impulse taking place, we've created a downtrend channel on the lower timeframes.
Looking on the H4, we have clearly identified both a non-horizontal support and resistance level. We could notice that price is currently headed towards the bottom of the channel. If sellers manage to bring price below the current support level it's sitting at, this pair could have some more bearish movement before we see a correction wave towards the upside. Take home point to apply in the markets, USD strength seems weak.


USDOLLAR Spinning top
bearish structure
going into this week, we would be looking for downwards price action
but we need to be aware of reversal levels which are marked with a orange line.

USDOLLAR - Reflection PointFX:USDOLLAR
Hello Everybody, here we have the USDOLLAR INDEX on the Weekly chart. Over the past few months we have pretty much just been melting to the downside since making a double top around 12500. Price is now at a very significant level testing both the neckline and a major weekly descending trendline which was broken in March.
We currently have two fibs in play, a bullish fib on the weekly timeframe with price hovering above the 786 Level and a daily bearish fib giving us some room to come down, this will allow us to continue to short the Dollar on the lower timeframes.
We are hoping in the next couple of weeks we will have a clearer indication of where the dollar is heading in the coming months, should next week(s) candle close below the 786 level instead of rejecting it then we are anticipating further Dollar weakness.
If you look below at the daily timeframe you can see that we are still making higher highs and higher lows, respecting the bearish daily 618 fib level, EMA and trendline therefore the dollar can continue lower to around 11500 before either a daily correction or a much deeper pullback takes place.
If you have found this useful then why not join our free telegram on the links below, you can find more chart analysis and setups as well as educational content.

USDOLLAR : DOW JONES - THE BREATH OF THE DOLLAR 🔔Welcome back Traders, Investors, and Community!
Check the Links on BIO and If you LIKE this analysis, Please support our page by hitting the LIKE👍 button
Traders, if you like this idea or have your own opinion about it, please write your own in the comment box . We will be glad for this.
Feel free to request any pair/instrument analysis or ask any questions in the comment section below.
Have a Good trading day!

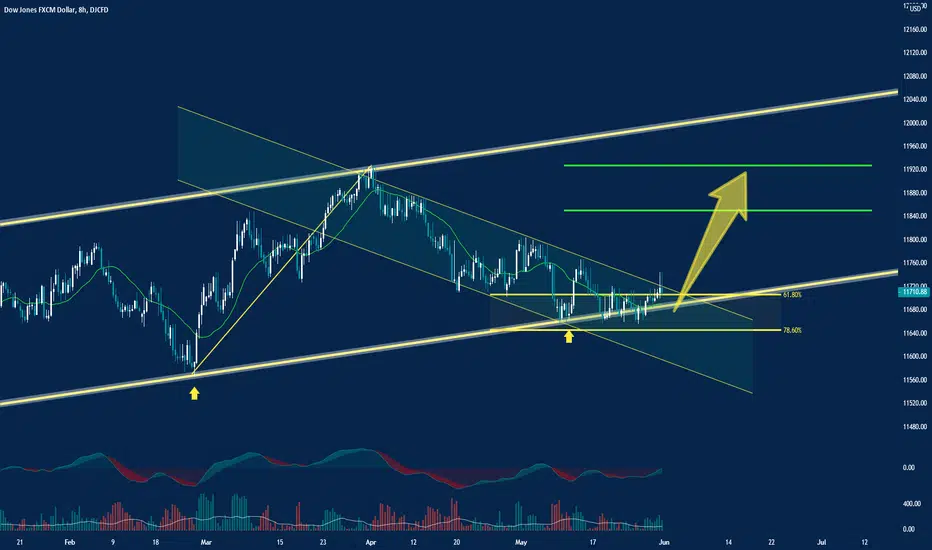
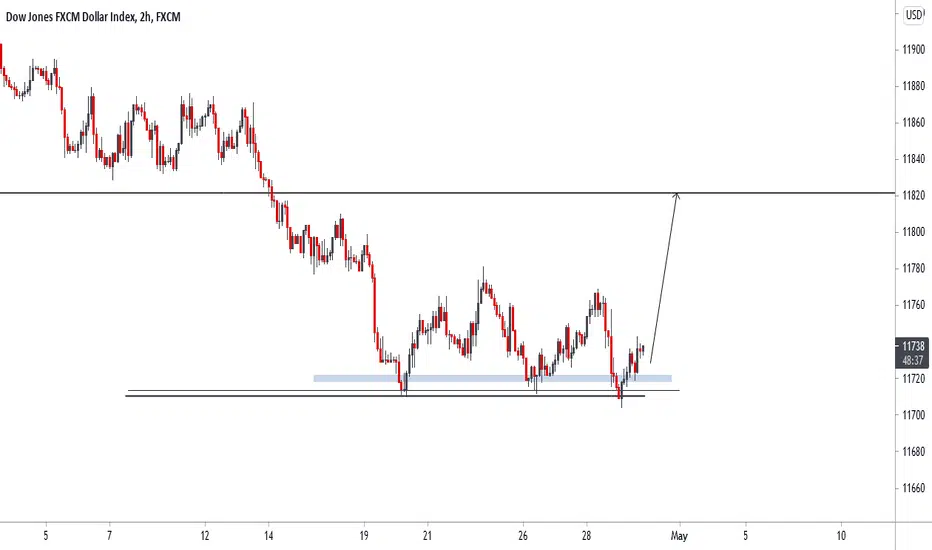
Dow Jones ForecastFunda : Fed Chairman Jerome Powell noted that recovery is still far from complete and while inflation pressures could rise in coming months, effects would be temporary. US Dollar held losses after the speech from Powell and is expected to continue losses as more high impact news today might reveal good news causing the depreciation of the dollar.
And The Dow Jones is looking bullish from the 11720 area at the H2 Chart. So, TA and Funda not agreeing again?
Bullish interest - USDOLLAR.
.
Khiwe
At this profile page, the shared analysis, ideas and also, the strategy of a chart belong to Khiwe with some being influenced. The technical set-ups are speculative, they are not guaranteed for accuracy or in completeness in the form of any content; -it is not to advice on financial markets. Please apply your own analysis and confirm it with price action.


USDOLLAR BullishnessLooking for continuation of bullishness due to impulsive break of the range, i'll be looking for price to either come and retest the area before pushing higher, or create a structure above range to buy from.


USDOLLAR made higher lowI'm assuming next week will be a good buy signal for US dollar as the graph shows a possible higher low.


USDOLLAR Index Retesting Double Top NecklineUSDOLLAR Index Retesting Double Top Neckline for Further Weakness

USDOLLAR Index ForecastDollar in Range and will break either side after Accumulation or Redistribution of Prices


USDOLLAR: PULLBACK ON SUPPORT 50% FIBO - BUY SETUP 🔔🔔Welcome back Traders, Investors, and Community!
If you LIKE this analysis, Please support our page by hitting the LIKE 👍 button
Feel free to request any pair/instrument analysis or ask any questions in the comment section below.
Strategy : PULLBACK ON 50% FIBO
Good trading at everyone!

USDOLLAR SnR Set-upUSDOLLAR, H2 (Improved job reports stimuli) -UP
.
Khiwe
At this profile page, the shared analysis, ideas and also, the strategy of a chart belong to Khiwe with some being influenced. The technical set-ups are speculative, they are not guaranteed for accuracy or in completeness in the form of any content; -it is not to advice on financial markets. Please apply your own analysis and confirm it with price action.

DXY technical analysisDXY on the higher timeframes has shown us that we should be bearish. Taking it down to the 30minutes timeframe, we see that the drop is in motion but we are retracing to the grey area of liquidity.
