DXY - Short Opportunity-21The Price break horizontal line & moving towards upper trendline.
You can place sell stop for execution of the trade or wait for price action to short
USDOLLAR trade ideas

USDOLLAR index 1-2-3 Trend reveral complete! Initially prevailing Downtrend - Yellow line.
1- Downtrend is disrupted.
2- Temporary new dip is made (either higher, equal, or lower than prior immediate bottom).
3- Old previous high of 2 is taken out.
If all 3 points are taken out, this is a 1-2-3 trend reversal.
For further information:
thepatternsite.com

Dollar Index AnalysisLooking at the Dollar Index we can see a Double bottom and an Ascending Triangle formation on the neckline to break the barrier for the dollar to strengthen. Ascending Triangle is a continuation Price Action pattern
So we can see the Dollar strengthening against all the Major FX pair. Watch out for that move.


USDOLLAR : PRICE ACTION IN HIGH TMF , PRICE IS GROWING ! 🔔🔔🔔Welcome back Traders, Investors, and Community!
If you LIKE this analysis, Please support our page by hitting the LIKE 👍 button
Feel free to request any pair/instrument analysis or ask any questions in the comment section below.
Strategy : RETEST BEARISH CHANNEL
Good trading at everyone!

USDOLLAR : PRICE ACTION IN DAILY TMF , PRICE IS GROWING ! 🔔🔔🔔-UPDATE
Welcome back Traders, Investors, and Community!
If you LIKE this analysis, Please support our page by hitting the LIKE👍 button
Feel free to request any pair/instrument analysis or ask any questions in the comment section below.
Strategy : Re-test Bearish channel + Fibo pullback
Good trading at everyone!

USDOLLAR : PRICE ACTION IN DAILY TMF , PRICE IS GROWING ! 🔔🔔🔔Welcome back Traders, Investors, and Community!
If you LIKE this analysis, Please support our page by hitting the LIKE👍 button
Feel free to request any pair/instrument analysis or ask any questions in the comment section below.
Strategy : Re-test Bearish channel + Fibo pullback
Good trading at everyone!

USDOLLAR : PRICE ACTION 1D TIMEFRAME - PRICE READY TO GROWTH ! //UPDATE//
Welcome back Traders, Investors, and Community!
If you LIKE this analysis, Please support our page by hitting the LIKE👍 button
Feel free to request any pair/instrument analysis or ask any questions in the comment section below.
Strategy : Re-test Bearish channel + Fibo pullback
Good trading at everyone!

Is there any doubt which direction the US dollar is going?Is there any doubt which direction the US dollar is going? You gotta know with the addition of $1.9 trillion new $$$$ that the money supply has to be out of whack with demand.


USDOLLAR : PRICE ACTION 1D TIMEFRAME - PRICE READY TO GROW ! 🔔Welcome back Traders, Investors, and Community!
If you LIKE this analysis, Please support our page by hitting the LIKE 👍 button
Feel free to request any pair/instrument analysis or ask any questions in the comment section below.
Strategy : Re-test Bearish channel + Fibo pullback
Good trading at everyone!

USDOLLAR (07-March-2021)Monthly Chart:
Weekly Chart:
Daily Chart:
4H Chart:
USD is hitting the monthly resistance zone and you can plan for buying it for rebound.
Before trading, identify and setup a trading plan for the time frame that you are comfortable with.
Imagine how the price action may perform next week and if the price act as you have planned, execute it with stop loss.

us doller time to riseThe collapse of the USD seems to be over. The reason for this is that the down trend pattern started from 2020-03-20 and the trend line that existed from that day to date has now been strongly broken. Additionally, the cash flow index shows that a clear new capacity is being added to the market, so all USD pairs are preparing for a sharp fall, already creating a direct bull wave in the USDJPY and USDCHF markets and losing against the USD. Of course it is happening to EURUSD, GBPUSD, NZDUSD, AUDUSD and USDCAD is also creating a new uptrend with an informal inverted head and shoulder.

11700 -10% expected? Can DYX break down the support line? If We break down lets say 5-10% can $BTC grow 10k every 1% that US Dollar goes down?
Can we make a more predictable model?
How much is the weight of the money flow coming from Dollar in 2020-2021?

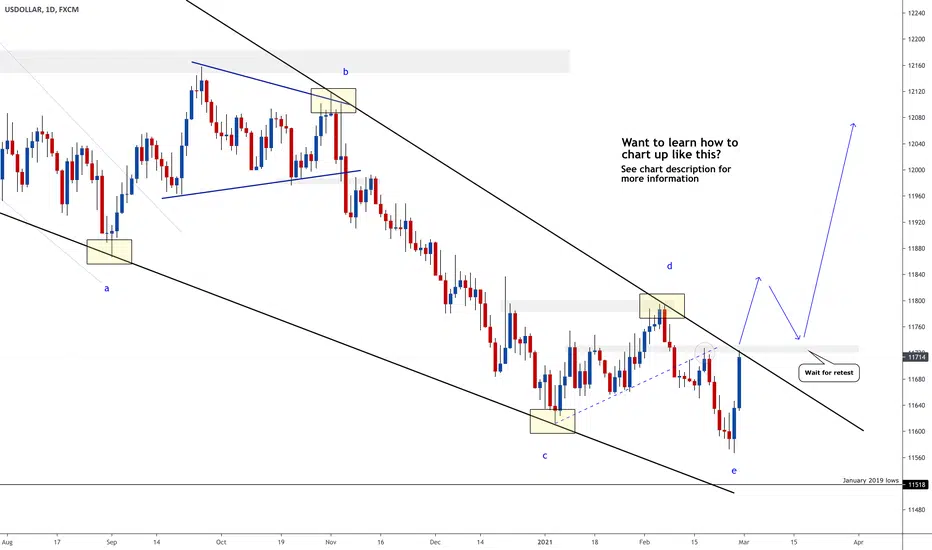
USDOLLAR - Dollar Strength This Week?Price made an abcde ending diagonal and looks like we're about to break the wedge. We'll monitor and see if it breaks and get in on retest. SO many opportunities if this breaks...
See links below for more in-depth opportunities.

USDOLLAR - Dollar Strength This Week?Price made an abcde ending diagonal and looks like we're about to break the wedge. We'll monitor and see if it breaks and get in on retest. SO many opportunities if this breaks...
See links below for more in-depth opportunities.


USDollar INDEX...BEARISH CONTINUATION . BTC GOING UP?In the long term...What do you think about this analysis?

UsdThe US dollar continues to drop, this was a setup I uploaded awhile ago... My Tp1 was finally hit..
My new setup will be uploaded soon😊


USDollar INDEX...RED CANDLE . BTC GOING UP?I'm being watching the inverse correlation between US Dollar INDEX and BTC over the past month.
Dollar going doing means BTC going UP!
