USDOLLAR LONGWe can potentially see an upside for the dollar as it made a new high, and retested trendline. Currently, I am biased towards buying the dollar hoping it to reach previous support resistance, before coming back down for a trendline retest.
I will not be excited for longing it now. What I really want to see is a retracement after resistance to the trendline and take a long position as it offers a higher probability with a good risk-reward ratio. However, this is in the daily timeframe, any chances to the market condition may cause my analysis to be inaccurate. This perfect setup can be easily voided if news/economy does not go as planned so please take it with a pinch of salt, this trade can be invalid any point of time.
*Please note that I am no professional trader, like most of you people. I am still learning and know that trading is only a possibility game. My analysis does not mean it is a signal for entry. If you would like to enter with my analysis, please see if it matches with your analysis & thoughts. I will not be liable for any losses incurred :D *
USDOLLAR trade ideas

US Dollar breakoutIs that a breakout or what, like I said put an eye on the chart and an ear on the fundamentals.
Manage your trades!!!

Time to go short USDollar Index or Buy EUR/USDIt might continue upward few candles more but uptrend is done and it is time to go short!

USDOLLAR Rallies In Longer-Term DowntrendThe above charts show FXCM's USD index - the USDOLLAR. The left chart shows the daily time frame. It is evident that the current trend remains down, until proven otherwise.
1. Price is below the cloud.
2. The cloud remains light pink in colour.
3. Price is below the black base line.
4. The black base line is trending down.
5. The orange lagging span is comfortably below price.
The right chart shows the H1 ichimoku of the USDOLLAR. The index has pulled back in the shorter term.
1. Price is approaching pink cloud resistance.
2. Price is above the black base line.
3. The black base line continues to move downwards.
4. The orange lagging span is at price.
The pullback is largely driven by fear creeping back into the market following comments by White House health advisor Dr Anthony Fauci noting that some US states are seeing a “disturbing surge” in coronavirus infections. Cases have increased by 5% or more in 26 states and hospitalisations are rising too.
To this end, we are closely watching the H1 ichimoku for any bearishness, which will realign the short-term chart with the daily. If this does not happen, the prospect of economic disarray cannot be ignored as the possibility and impact of a second wave is considered by market participants.
Past performance is not an indicator of future results
CHART SOURCE: FXCM MARKETSCOPE 2.0

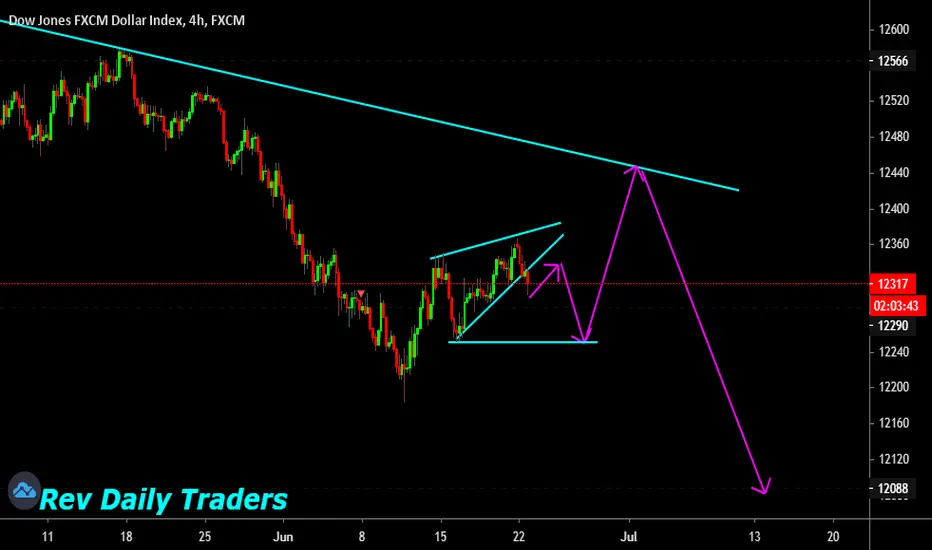
DOW JONES setting for shortcheck on lower time frame to start to sell, at the moment we have that building correction that needs to give us down wave, how you can trade this sell breakout or start from roof on lower time frame to sell
we looking to sell, we will ignore buys

US DOLLAR IdeaBig broadening wedge forming
Hopefully the recent drops acts as a double bottom and pushes price back up into the wedge
The recent touch of the fib transition line suggests the action through it will be bOOlish


trendexit over sell in RSI indicator and break center line and go raise again. and touch support line and react to it

US Dollar index- Hitting long term support UpTrend line. US Dollar index- Hitting long term support UpTrend line.

US-dollar Index Time Analysis.There is a good opportunity to go long and keep the position up to 2 days.
Good Luck!


USDOLLAR Down Trend Continues But Is OversoldFXCM's USD index, the USDOLLAR remains in a downtrend. The left chart shows the daily time frame and the index is below its black 20-day SMA. The SMA is also pointing down confirming the downwards pressure. We note that the RSI is well below 20 and is oversold (blue rectangle). Moreover, we are looking to see of the index is at support (red shaded horizontal). The right chart shows the RSI at 50 and the hourly EMAs on top of each other. We are looking to see how these resolve because if the EMAs cross bullishly and the RSI moves above 50 than it suggests that we are at the support level as denoted by the red shaded horizontal. We continue to watch.

DOW JONES on more before we upif you consider selling the breakout then remember to put it on breakeven or take profit fast,then we will be looking to bounce for us look for buy setup

Structural change in USD vs GBP and EUR (post covid stagnation)USD has made a substantial "lower low" and this is matched by the EUR making a substantial "higher high".
However GBP is failing to keep pace and is not making the higher high...
USD also coming into some lows as NFP approaches tomorrow.
I anticipate USD to drive down to complete the sell-off and then we may see a bullish shift (and bearish EUR +GBP etc).
As for signals - look for daily swing lows (USD) and daily swing highs (EUR + GBP).
FX:USDOLLAR
FX_IDC:EURUSD
FX:GBPUSD

US Dollar DJ Index- Hiting long term uptrend support levels. Dow Jones FXCM Dollar Index was a measure of the U.S. dollar’s value equally weighted against four of the world’s most liquidly traded currencies:
Euro (EUR), 25% weight
British Pound sterling (GBP), 25% weight
Japanese Yen (JPY), 25% weight
Australian Dollar (AUD), 25% weight

The DollarDear Traders,
It has been a while that I shared my dollar views. Before price broke out of the daily range, I was extremely bullish for the dollar, but since we tanked there was not much to do regarding planning a bullish trade.
However, price finally found our daily demand area, combined with the weekly long-term trendline, which will probably push this dollar higher towards at least 12480.
Keep your eyes on it and look for plays on EU. The intra-day charts for USDollar already showed us some bullish pressure, EURO should provide the same later today for a potential move.
Best regards,
NewCapitalFX

USDOLLAR Downside Momentum Increases On the DailyThe above chart shows FXCM's USD index, the USDOLLAR. It is below its EMAs, with the green 5-day EMA below the orange 13-day EMA, and the orange 13-day EMA below the black 34-day EMA. Moreover, all three EMAs are showing angle and separation to the downside (red ellipse). This is a sign of strong downwards momentum and as long as this formation holds weakness is likely to persist. We also note that the support around the 12,420 level (green shaded horizontal) has been broken to the downside. If price drops further, this level is likely to evolve from support into resistance.


Titán Elliot Views on USDOLLAR INDEXPosible Corto al finalizar triangulo contracto.
Forma parte de nuestra comunidad de analistas bursátiles. Cronos Capital
-Nuestro sistema aplica para cualquier mercado financiero.
-Trading de precisión con algoritmos interbancarios y patrones Market Maker.
-Canal de señales de precisión y proyecciones Elliot wave.
Vamos a crear los mejores analistas bursátiles, y en el camino tendran libertad financiera...

