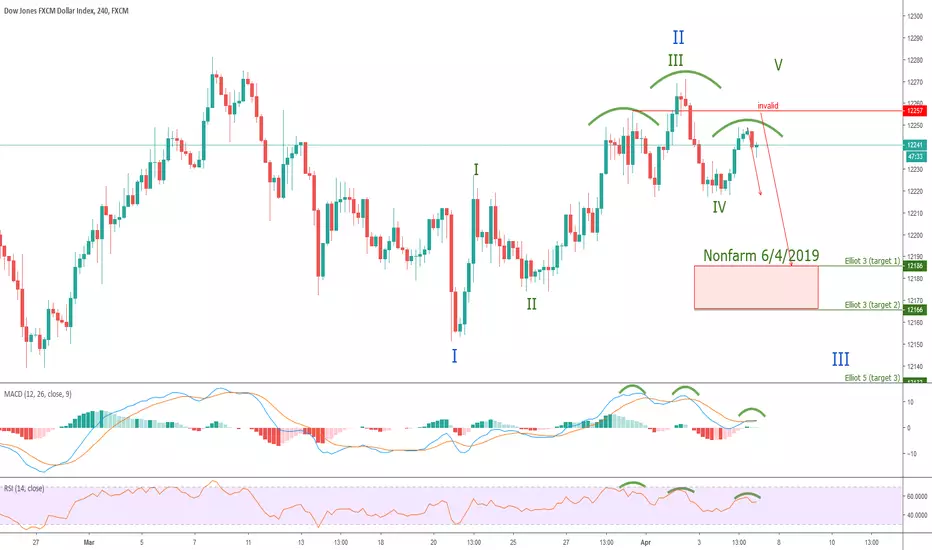
USDOLLAR - short with Nonfarm news 06/04- Head and shoulder: Chart - MACD, RSI for a sell.
Good luck.
USDOLLAR trade ideas
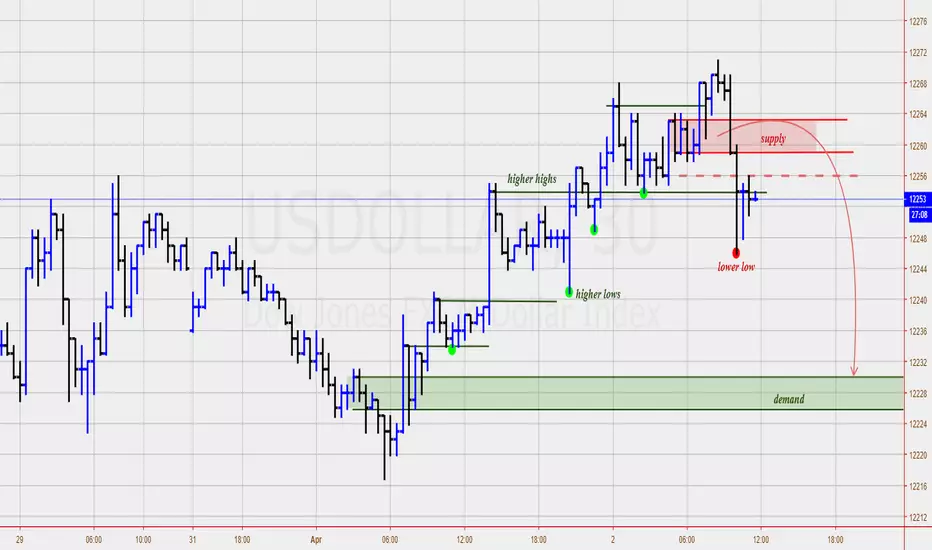
USDollarSmall time frame - price has built supply above which needs to hold to send price lower into demand. Price has suggested that with the lower low we should see a lower high, again supply needs to hold
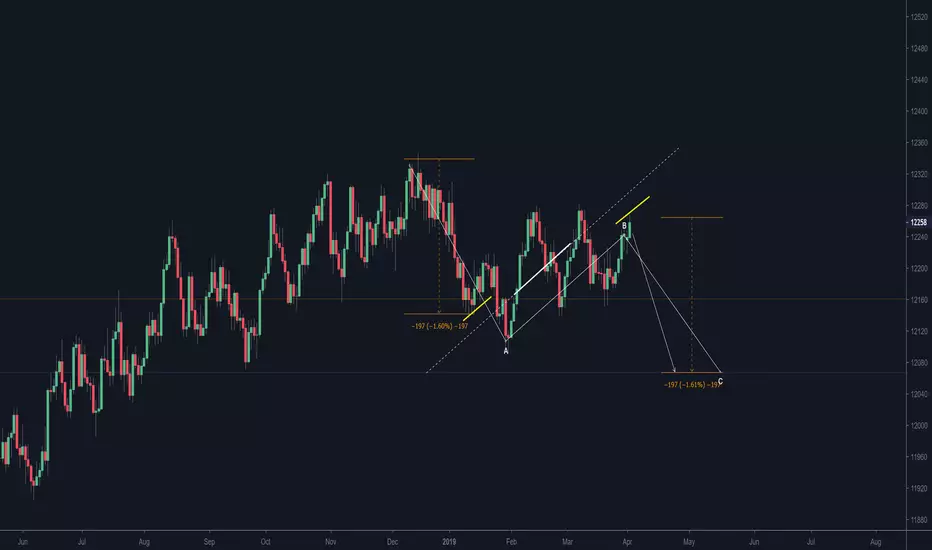
USDOLLAR 1.6% decrease... The exchange rate moves in a declining double wave structure. Currently, it is in the correction phase with the axis of the exchange rate ATR axis. On this axis, the rising correction movement is moving. Although apparently now acts against the theory, I assume that the correction movement at this level can be completed and the second decreasing wave structure is built. The target price can be 1200 usd.


USDOLLAR(4hr chart). Possible Bat at res, H&S target,RSI at Res.USDOLLAR(4hr chart). Possible Bat at res, H&S target,RSI(daily) at Res.

Pair Of Bearish Advanced PatternsJust a quick find on a pair of patterns (Bear Cypher and Gartley). Well have to track them and see how they play out...

USDX TRADING. LONG DOLLAR TRADEUSDOLLAR HAS REACHED A LEVEL OF SUPPORT.
I EXPECT A PUSH UPWARDS FOR 60 POINTS.
ACTION TIME
BUY US DOLLAR ON ALL PAIRS UNTIL USDX HAS HIT 60 POINTS


USDOLLAR before 2% decrease... The figure shows a white ATR axis and a green wave axis. I guess the "auxiliary axle" mirrored on the ATR axis can be the current rise resistance level. I look forward to turning this axis. Further wave structure can be determined by the green wave axis. The symmetrical wave motion on this axis may be descending with a target price of 11975 usd.

USDOLLAR Supply And Demand Weekly AnalysisWith price down at Weekly Demand (DBR) im bullish the USD, with USD in demand its a plus if we can find other USD currency pairs to match up with it.


US Dollar (USDOLLAR) (DXY) Correction Before BreakoutThe US Dollar Index appears to have stalled in a supply zone, and needs to regroup before climbing higher. Expecting a return to 1200 prior to ATH's.


supply and demand usdollar analysislooking for weak usdollar across eurusd, gbpusd,usdjpy, all usd pairs.. lookout for price to come into daily/4hr supply and we will get initial sell off and hopefully continue price down.. cheers.

Dollar Approaching Bearish Wolfe Wave TPI will be looking at long positions in favour of the dollar a few points below the green ray which is the Bearish Wolfe Wave target.


US Dollar: Mind the scallopsScallops are broad patterns as shown in the chart. Whilst de-dollarisation is happening at a slow macroeconomic pace, coming from Russia, China and Japan (largely), it doesn't mean that the US Dollar will simply roll over.
The pattern of the scallops is quite visible. Now the US-Dollar is at a critical point and making attempts to do another scallop. I don't assume that each scallop will be less prominent than the previous. Overall the trend from April 2018 seems to be weakening but I make no assumptions that in the short term (next few weeks) the US-Dollar will not bounce north.
US-Dollar strength is broadly inversely correlated with commodities, metals and US-stock-markets - whilst affecting the strength of other currencies indirectly.
The pattern is useful in terms of assessing other positions in the markets both on Stock Markets and Forex.
