USD Reversal on the monthyUSD is signaling that it is about to shift back up. 7 days for confirmation on this.
Haven't traded FX in months, but I'll be keeping an eye on the monthly close next week.
USDOLLAR trade ideas

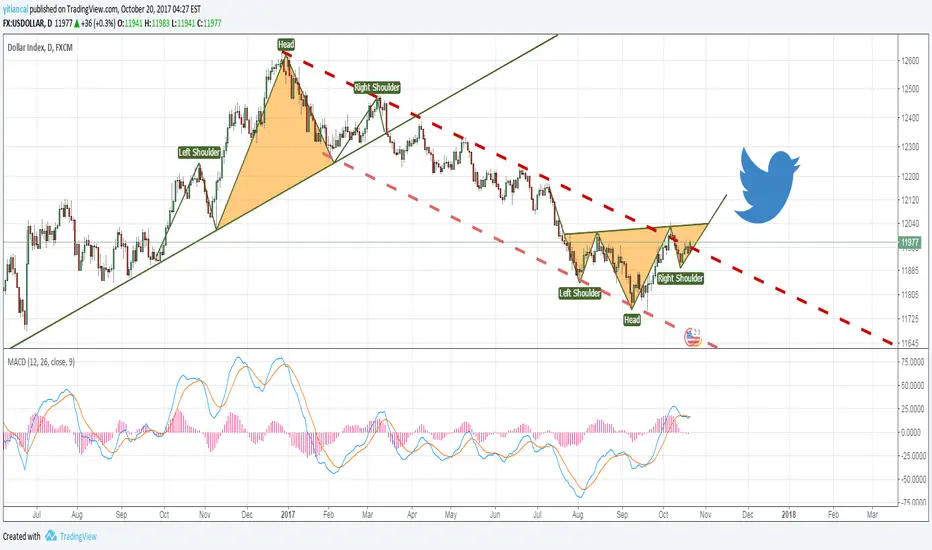
Forming H&S +Cypher of Usdollar Index, Idea in Several PhrasesIn Daily Chart, I find an interesting combo of Usdollar index, which is favor of my previous idea on rebounding DXY.
There is also a bearish cypher targeting to 12130, a mid-term goal which may cost at least 2-3 weeks to reach.
Besides harmonic pattern, classical pattern head and shoulder also gives a bullish bias, though it is in progress.
Thus we may adapt our trading plan in following phrases:
Phrase 1: Watch prcie action near 12000.If fail to stand above, hold bearish idea till around 11870 level.
Phrase 2: If Price get support near 11870, creating a higher low point, proper time to hold bullish idea, with TP1 at 12000 level, TP2 at 12130, also the D point of Cypher pattern.
Phrase 3: If there is good FA factors relate with tax reform etc, watching TP3 near 12236, otherwise, check short opportunities near 12130
It can be regarded as a specifc trading plan even u check the chart of DXY, which I mentioned in my previous post below


Wait for the head and shoulder! USD may rise in the longtermYou can see two head&shoulder in the chart. For the frist pattern, it's the beginning bearlish trend of USDDOLLAR.Now, the price is out of the decline channnel,it means that the decline trend has already change ! And the MACD is above the 0 zone.If the head&shoulder bottom is formed ( it has not been formed yet!), the trend of USD will competely change! 12043 will be the key point!

Potential head and shoulder in USDOLLAR-bullish way for USDOLLARYou can see two head&shoulder in the chart. For the frist pattern, it's the beginning bearlish trend of USDDOLLAR.
Now, the price is out of the decline channnel,it means that the decline trend has already change ! And the MACD is above the 0 zone.
If the head&shoulder bottom is formed ( it has not been formed yet!), the trend of USD will competely change! 12043 will be the key point!
US Dollar downtrend over?Here is the US Dollar index with a nice inverse Head & Shoulders, and at the moment it is currently breaking the descending trendline, which is the first sign of a possible end of the downtrend. The second sign of a possible end of the downtrend is the bullish divergence on the RSI. The final sign will be a break of the neckline of H&S, and we could see the US Dollar rallying from there.

USDOllAR: Rebouncing, H & S plus Bearish CypherOn daily chart of usdollar, price get supported yesterday near 55 ma and forming a reversal pattern.
See if price can reach the label targets, neckline of inverted H & S, and the ideal entry D point for short.


DXY Daily Chart Reverse Head and ShouldersWatching the dollar to form the right shoulder of the reverse head and shoulders. Assuming that the low for the intermediate term has been formed, then this suggests that we are in a prime buying opportunity to test the long side for the dollar.


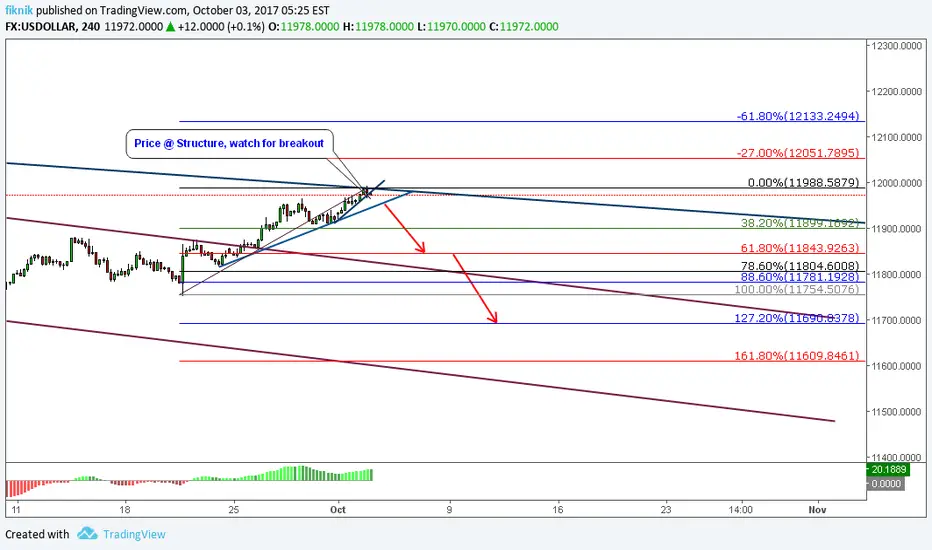
USD: Bearish resumption or bullish breakout?Following up on my recent ideas of eurusd long and gold long and usdchf short ...Looking at the us dollar index chart, it also confirms that we are at potential reversal zone and a key trading area. We are testing the top of the channel and the horizontal resistance and key high at 12012.
As i mentioned earlier, we need a fundamental/economic catalyst to push the us dollar higher, as of now, we do not have it. So i am in favor of the bearish resumption scenario.
However, as a trader i should trade what i see and adapt with what the charts give me, so i would stop and reverse my bias from bearish to bullish on a break above this resistance area.
Best
Technician

DXY Long Opportunity!Hello traders! We had the first strong impuls up on dxy. We are expecting it to continue moving to upside. Wait for a correction in lower time frame before entering long.
TRADE WITH NO EMOTIONS!


DXY @ Structure: SHortWatch the trade set up
Disclaimer: This is my trading opinion; it is neither recommendation nor invitation to trade.
USDollar Analysis
We have seen the MAs crossover on the monthly, weekly and daily timeframes, indicating future bearish momentum.
I foresee price coming down to the 11650 monthly support area which lines up with the monthly upward trend line that could result in a 3rd retest of the trend line which could take us to new highs of 13254 which is weekly resistance and lines up with the 127.2% fib extension level.
However if further dollar weakness arises along the coming weeks, this could mean we could break the monthly trend line to the downside, with our next immediate target being 11325 and 11000 as the next target should bearish momentum continue.
However my short term bias for the dollar is bearish & long term bullish.

US Dollar birds eye viewThe US dollar has been bullish for the last 4 weeks, but could we see a retracement before further upward movement?
On the daily/weekly chart we are about to hit a possible resistance level at 0.382 Fibonacci which is close to the counter trend line, and also on the daily chart the RSI seems close to overbought. Long term i still think we can ride the bull. Good luck

This more diversified USD is breaking 23.6%and a daily T/L with multiple touches...of course day is not finished

Good times for US dollar coming up?US dollar is sitting inside monthly demand zone after several attempts to go lower. Though still in a down trend, could it be close to turning around?


USDOLLAR rising wave...USDOLLAR rising wave. The exchange rate came round. The increase, albeit with increasing momentum, is moving in a flat ATR field. Therefore, up to a level of 12065, a near 50% correction is expected. Then, the resulting wave will be able to produce up to a full turnaround.

$ indexIt shows some downside...We should see some rally EU, GU, AUDUSD, NZDUSD.
Be caution, it is counter trend trade.
