USDOLLAR SHORTAfter breaching the demand zone,price has returned to the zone now a supply area to test it.
USDOLLAR trade ideas


DXY @ 61.8%Price pull back to 61.8%, if trend line break,
Long with SL: 11735; TP1: 11860; TP2: 950
Disclaimer: This is my trading opinion; it is neither recommendation nor invitation to trade.

$$$ USDOLLAR $$$ - Bullish LongtermIm looking for a BUY opportunity in USDOLLAR until the Support 2 has been taken out.

Long USD IndexDisclosure: RM Long. Price not disclosed. Entered on 08Sept17.
Shorts being squeezed. Seems a crowded USD bear trade with stretched indicators and price at important price zone. Already added 25% original size in 36hr consolidating flag breakout. Looking to build into this again if opportunity presents, conscience not to damage the R:R profile of the original trade too much.

US Dollar DivergenceSince July, US Dollar index has been in price divergence. Price action showing signs as well. Is it possible that turn around is coming on Weak US dollar


USDOLLAR H&S Patternjust an idea and H&S pattern , wait for the neckline breakout , by dollar breaking that it'll make euro-pound-aussie-new zealand drop. and usdjpy-usdchf-usdcad up up up.

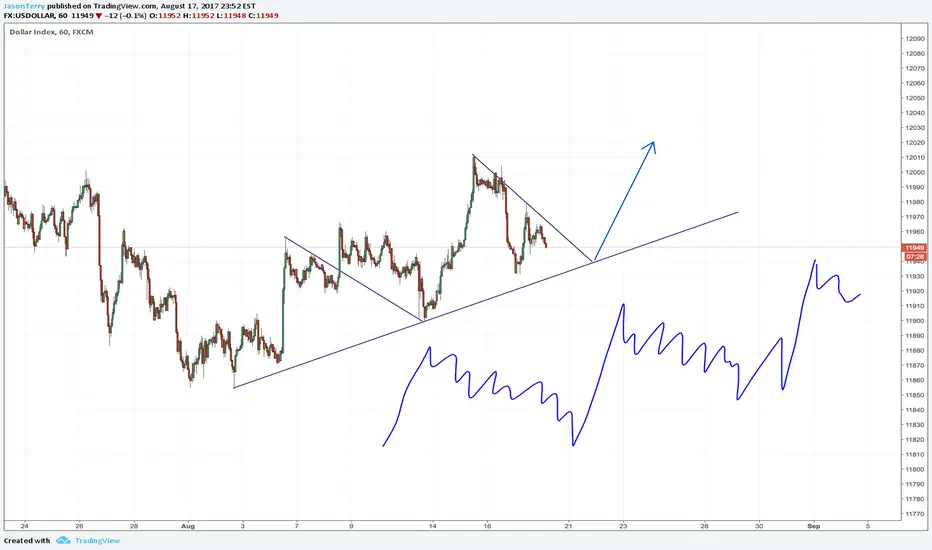
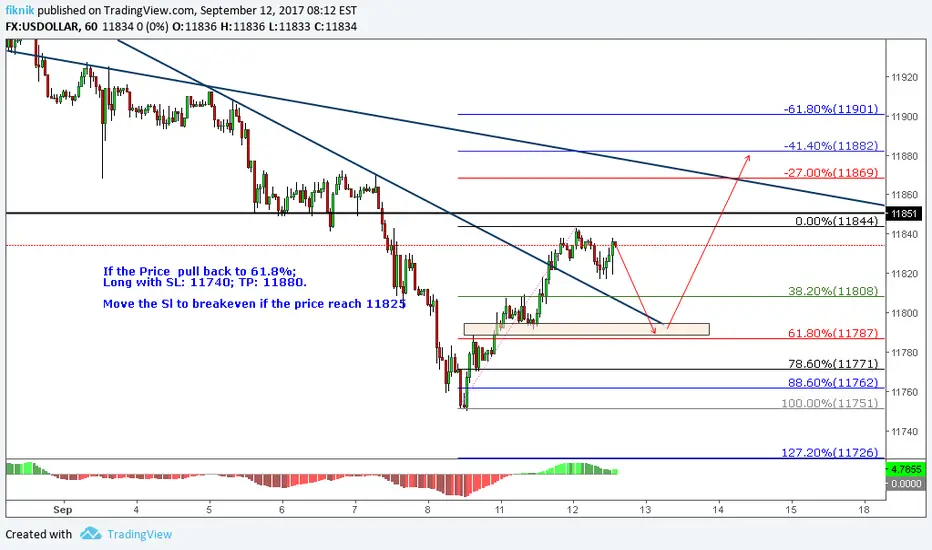
DXY: Watch for Pull Back & LongIf the Price pull back to 61.8%;
Long with SL: 11740; TP: 11880.
Move the Sl to breakeven if the price reach 11825
Disclaimer: This is my trading opinion; it is neither recommendation nor invitation to trade.


USDOLLAR at strong support and looks oversold and bullish soonUsdollar is at good support and double botton also oversold Rsi and others indicators show it and bullish anytime soon.Ecb tomorrow could help it to start getting bullish.Also Gbp looks neutral and Brexit still in process.Aud at resistance and Jpy at good support.

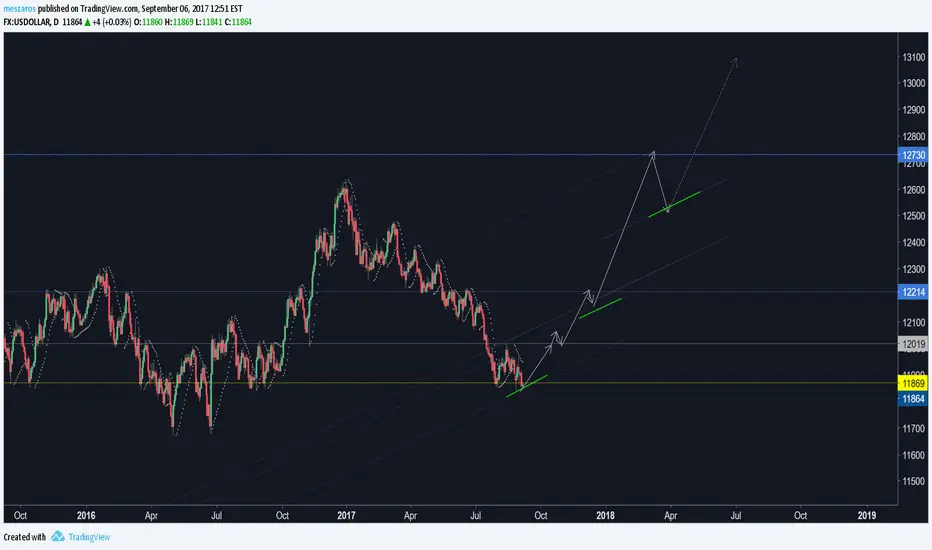
Stable gains can be seen in the dollar index...Stable gains can be seen in the dollar index. Our assumption is that the exchange rate is going to turn. This 11866 level is the correction level of the previous W1 ATR. In the event that you turn from this level, you will have the opportunity to have a stable long-term increase. Since the ATR axes are steep in this range, which means that fast growing traffic can be expected, a steeper start can be imagined. Our first target price is 12214 levels. After a minor correction, I expect a significant increase again. From this wave structure it would be possible to reach another maximum around the 12730 level. Again there is a correction. Its magnitude can decide the direction and size of the additional wave motion. That is why I will return to this later.
The Dipping DollarUSDOLLAR is currently in a falling wedge due to the weakening of the currency index since the start of the year. As we approach minor supports, we're broken under a relatively strong supply area and also the daily 200 EMA. A weak breakout of the falling wedge could push the price further down and create a head and shoulders on a diagonal neckline (which historically has a tendency to break down more aggressively) - moving the price down to a support that hasn't been successful breached since it was created in early 2015.

!The actual possibly is high!Multiple reasons lead to the idea of a UJ long situation over a short. First is USDOLLAR INDEX is testing a support as seen on the right chart, while USD/JPY is testing as well its own support line. JPN looks exhausted and needs to take a nap most likely.
---------------------------------------------
Fx - USD/JPY
Chart timeframe - 6hr
Area of interest - 109.5, 114.5
Potential target 1 - 112.75
Potential target 2 - 113.5
Potential extended target - 114.5
---------------------------------------------
Trade Safe everyone!

Dollar Index Entered Demand Zone
Price entered demand zone in hourly chart where it is also a demand zone in weekly chart. High chance to break to the upside. Demand zone is 11907-11917. Below that means I'm wrong.

Double top short setupPrices have tried a number of times to test and break the high of 1.1961 set at 11AM with a range setting up after the nice rally look for a short to test the lows before looking to get long again.

Dollar index ShortHi
Dollar index broke down chart pattern. Tomorrow I believe that EURUSD will go to up with EURGBP because the GBP is weak.

USDOLLAR rising wave structure.USDOLLAR rising wave structure. In our opinion, USDOLLAR's exchange rate has begun to rise. The first correction level for the rise is around 12184. We are expecting a correction from this level. Its size, we think, is half-wave size. Then we expect the exchange rate to rise again. The climb can go up to 12396 levels. If the assumption was correct, movement followed the strategy, we went back to the other processes.