My layout of correlations
I always monitor correlations before doing day trading or swing trading on more assets, at the same time.
Correlation is a measure that defines how different assets move in relation to one another. The more the correlation coefficient is, the more they are aligned closely.
My layout of correlations here.
US Dollar and SP500 as references at first row of each table. My list of tickets consists of several subsets: Indices, Commodities , Financials and Currencies.
My Layout is 1x5
Correlation Frame 1x1 --> Daily perspective (timeframe 4h, lenght for calculation of correlation = 6)
Correlation Frame 1x2 --> Weekly perspective (timeframe 4h, lenght for calculation of correlation = 30)
Correlation Frame 1x3 --> Monthly perspective (timeframe 1D, lenght for calculation of correlation = 20)
Correlation Frame 1x4 --> 2-Monthly perspective (timeframe 1D, lenght for calculation of correlation =40)
Correlation Frame 1x5 --> 3-Monthly perspective (timeframe 1D, lenght for calculation of correlation = 60)
You can find this indicator in Tradingview, Tab indicator & strategies , by typing gCorrelations
USDOLLAR trade ideas

USDOLLAR Will Go Higher From Support! Buy!
Hello,Friends!
Indecision in the market is changing
Towards a clear bullish sentiment
And the price action on the lower timeframes
Is clearly supporting this narratve
Therefore, I think it is a good idea to go long!
Like and subscribe and comment my ideas if you enjoy them!

USDOLLAR ForecastHi there
The USDOLLAR chart has mixed signals from the indicator report panel. Volume, Stochastic, and MA see a bullish presence visible in the current candle, but the DMI and MACD are bearish.
So we can assume that we should see a pullback.
- (fx) symbolizes bearish attraction to the lows behind it and near it. And we prove it with a trend-line (the light line).
13309 and 13248 are the closest targets with two zones below them.

USDOLLAR - Upper Channel RejectionDrawing a Channel on USDOLLAR showing a rejection at the top channel line
This could be compared to the previous rejection at the bottom channel line (in green circle) This assumption provides a more bullish long term outlook

Dow jonesDow Jones been respecting this channel for a while now, let's see how it goes
For me it looks like the bears are about to take over, from here forth

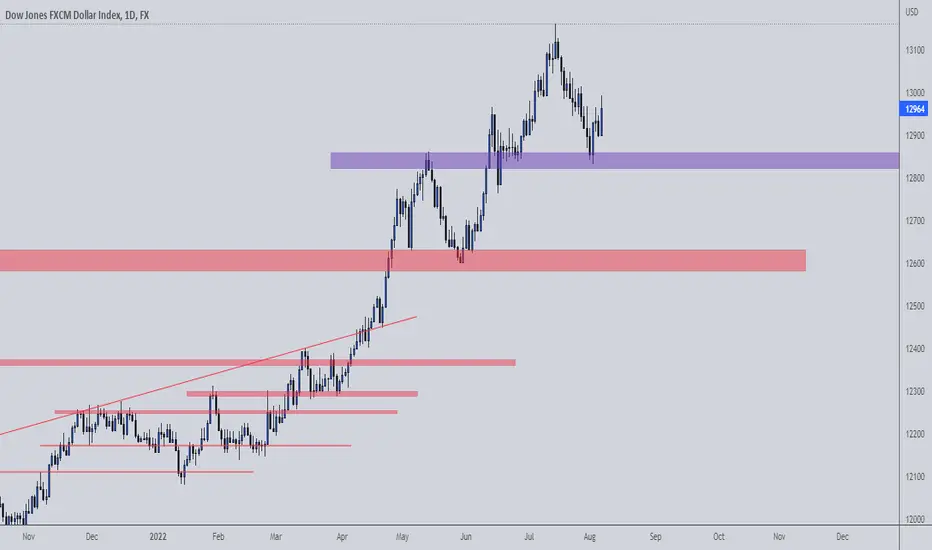
fibonacci retracement 0.382 and 0.618fibonacci retracement 0.382 and 0.618 are good levels to monitor for well structured trend like this on USDOLLAR


US Dollar Index Short US Dollar Index is at a resistance level. Yesterday was a clear rejection of this level with a daily pinbar.
Trade idea is possible rejection of price from this zone, which may offer a reasonable RR.
Trade on chart.

USDOLLAR: Bullish Continuation
Here is our technical view on USDOLLAR.
Our analysis is based on purely technical outlook.
According to our drawing USDOLLAR is coiling on demand cluster.
Based on our stand point the market will start growing.
Please, support our analysis with like and comment!
❤️ Please, support our work with like & comment! ❤️

USDOLLAR DJ : Bullish Pattern - New LONG impulse coming.The USD Dollar index, following The EUR/USD currency ( Link in description ), after a Double Bottom on the Support Area, precisely on the previous High Swing and the confluence of 61.8% Strong Fibo Level plus a rebound on the dynamic trendline, in the lasts session the price Broke the Neckline of this pattern ( on 18 August ) with a Strong bullish candle. On Friday the price continued to grow with another green candle. Following our Previous analysis, our Bias is for a continuation of the Bullish trend. A possible ABCD pattern continuation that shows the price over our Target line. Both Stochastic and Rsi are in bullish conditions, the first in Oversold with a divergence, like for the RSI also in divergence plus Bullish side. Now we are in Bullish Flag pattern formation , looking for a new LONG impulse

USDOLLAR Will Move Higher! Long!
Hello,Friends!
USDOLLAR current trading paterns are clearly pointing
In the direction of a long trade
That is why I am bullish on the USDOLLAR pair
And I think it will go up!
Like and subscribe and comment my ideas if you enjoy them!


USDOLLAR: Bullish Continuation
Here is our technical view on USDOLLAR.
Our analysis is based on fundamental & technical metrics.
According to our drawing USDOLLAR is coiling on support cluster.
Based on our view the market will rise.
Like & Comment Our Analysis, Please!
❤️ Please, support our work with like & comment! ❤️

USD DOLLAR DJ Long from Resistance and Double Bottom - BUY The USD Dollar index, following The EUR/USD currency ( Link in description ) , after a Double Bottom on the Support Area, precisely on the previous High Swing and the confluence of 61.8% Strong Fibo Level plus a rebound on the dynamic trendline, in the lasts session the price Broke the Neckline of this pattern ( on 18 August ) with a Strong bullish candle. On Friday the price continued to grow with another green candle. Following our Previous analysis, our Bias is for a continuation of the Bullish trend. A possible ABCD pattern continuation that shows the price over our Target line. Both Stochastic and Rsi are in bullish conditions, the first in Oversold with a divergence, like for the RSI also in divergence plus Bullish side.

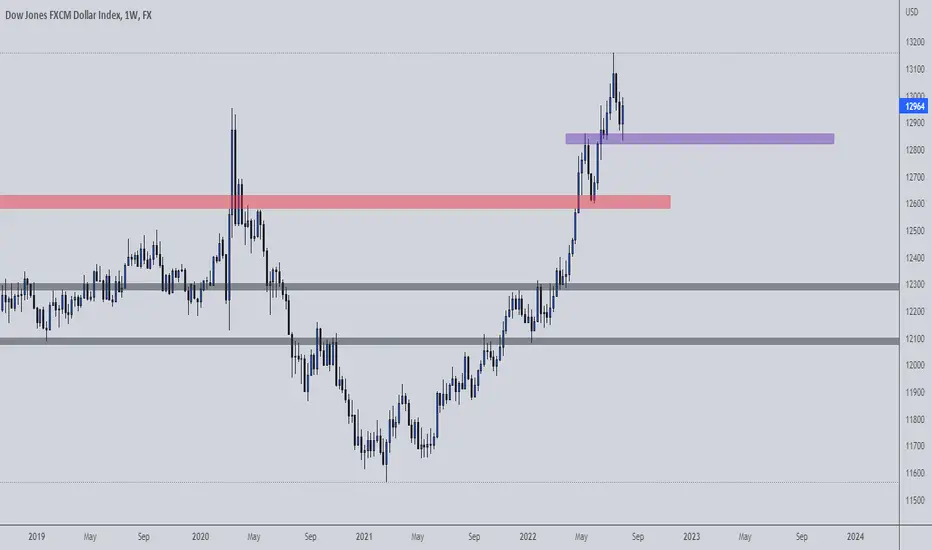
USDOLLAR: Double Bottom from resistance on 78.6% Fibo LONG The Dollar, strong from the Uptrend behind it, finds a stop to the retracement on the level 78.6% Fibonacci, on the price level $1285 support area where the price makes a Double Bottom before starting again to grow. There is a Divergence on RSI for the double top and the price is turned Bullish meanwhile the Stochastic also in Divergence seems ready to go out of the Oversold scenario.

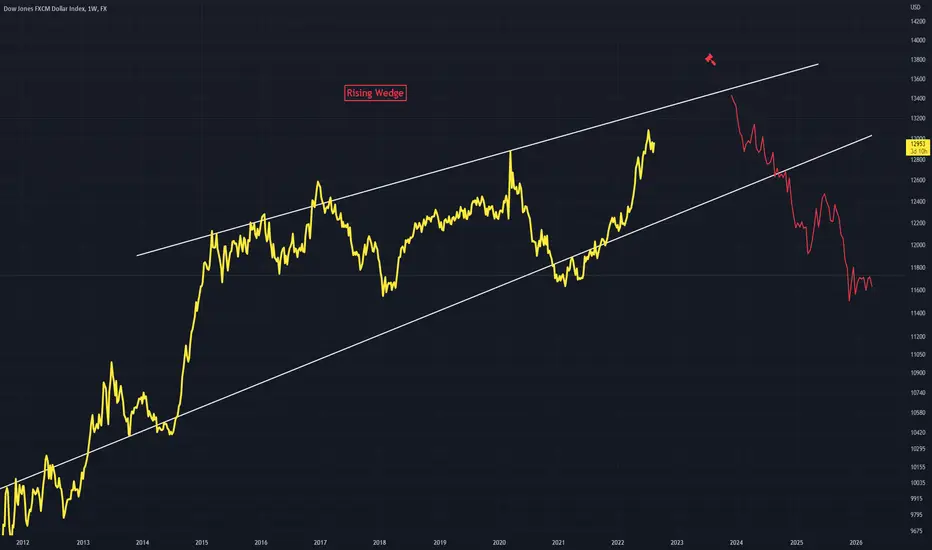
USDOLLAR - Rising Wedge Leading to Breakdown Rising Wedge is apparent on this Weekly timeframe
Rising Wedges like to act bearishly
The bearish breakdown once it occurs should push price to the green dotted horizontal
USDollar Dow Jones start to Grow - Pullback 61.8% Fibo LOND ABCDIn concomitance with the Falling of the EURO ( look my Idea about EUR/USD ) , the USD Dollar Dow Jones start to raising exactly in confluence with the 61.8% Fibo level in a strong support area ( White rectangle ) give a high chance to have the formation of an ABCD pattern bullish. The Stochastic seems ready to go over the Oversold, with a divergence, and the Forecast of Ichimoku it's Bullish. A new Long Impulse for USD?

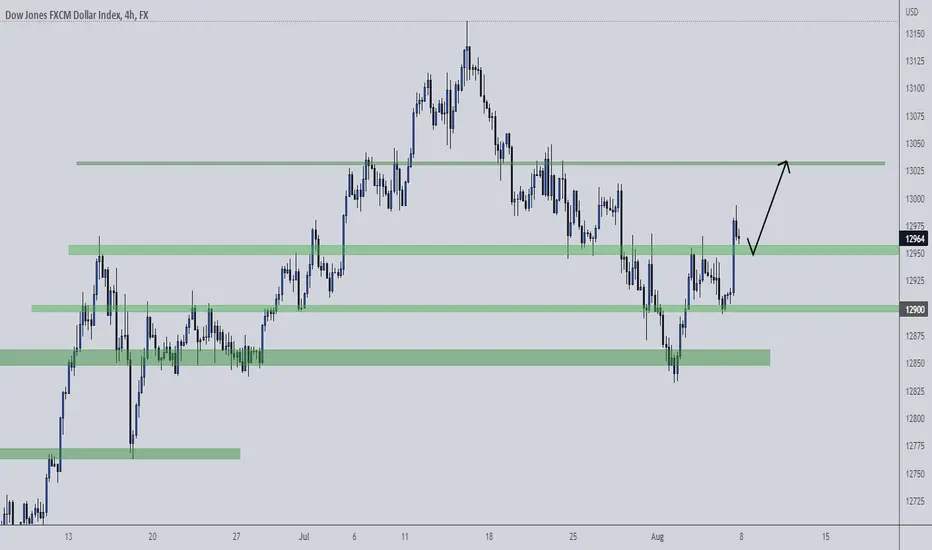
USDOLLAR Long Setup!USDOLLAR: market has been developing in a falling channel but managed to break to the upside recently. We have a beautiful retest on a resisting channel line, I am expecting this instrument to launch to 13050$ and possibly form a gartley pattern

DXY H4we broken a LH and we might see a slight retracement to the H4 price sensitivity zone b4 we see a further push to the upside
DXY,DAILYweek ended with a daily bullish engulfing candle forming a HL a sign for more buyers in the market
THIS IS IDEA FOR USDOLLARLook for a BUY opportunity when the inverted head and shoulder pattern is almost complete.

USDOLLAR: a quick analysisUSDOLLAR (Indices). if the trend breaks the low supply with out going to the higher supply then is the good time to enter the trade, if its not then we need to wait couple of hours to break down and enter the trade safely.
risk management: stop loss on 0.07% lowing chance, take profits on 0.39% incase if you did pre-trade then is 0.78%
Hope this one helps :)
