USDOLLAR: BULLISH BIAS, SIGN OF STRONGER ECONOMY?Hello Enthusiast Forex Traders! Here's medium-term outlook for USDOLLAR , Please give us the thumbs up and support the channel by Smashing the FOLLOW button :)
USDOLLAR formed a trendline false break on h1 timeframe. Afterwards, USDOLLAR already broke out of the Falling wedge pattern.The MACD already crossed upward above the zero area, it signify a probability of potential breakout in the near future.
The roadmap will be invalid after exceeding the support/target area.
DISCLAIMER:
This is only an outlook, not a recommedation to buy or sell the cryptocurrency.
USDOLLAR trade ideas

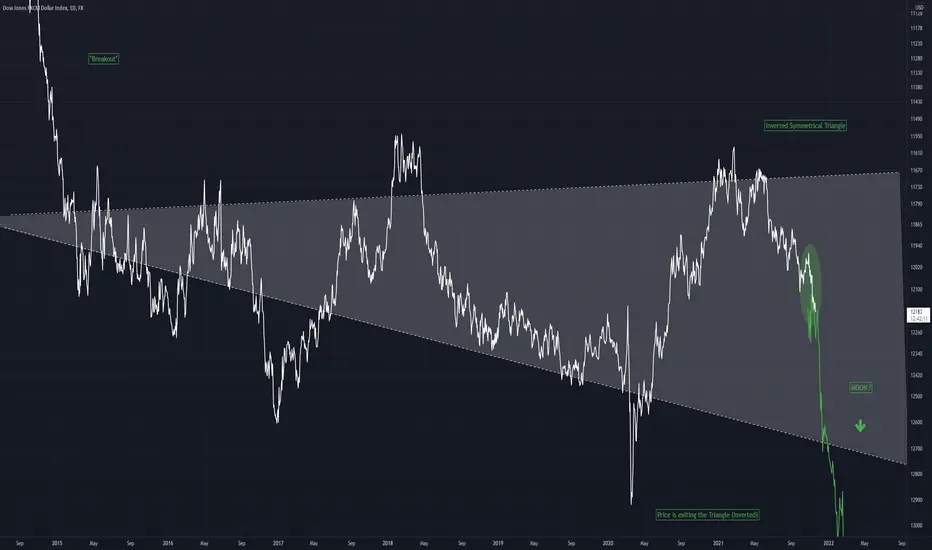
USDOLLAR Analysis - Symmetrical Triangle This is a chart for the USDOLLAR, which has been inverted to display the nature of a symmetrical triangle
Price can be seen to enter and exit on opposite sides
Using this assumption we can say that price will rise, at it climbs to exit the triangle (inverted)
USDOLLAR: DESCENDING BROADENING WEDGE, BULLISH BIAS ON DOLLAR?Hello Enthusiast Forex Traders! Here's long-term outlook for USDOLLAR, Please give us the thumbs up and support the channel by Smashing the FOLLOW button :)
USDOLLAR formed a trendline false break on daily timeframe. Afterwards, USDOLLAR is forming the descending broadening wedge pattern. We're looking for a breakout of the descending broadening wedge pattern to validate the bullish bias. The MACD starts crossing upward above the zero area, it signify a probability of potential breakout in the near future.
The roadmap will be invalid after exceeding the support/target area.
DISCLAIMER:
This is only an outlook, not a recommedation to buy or sell the cryptocurrency.

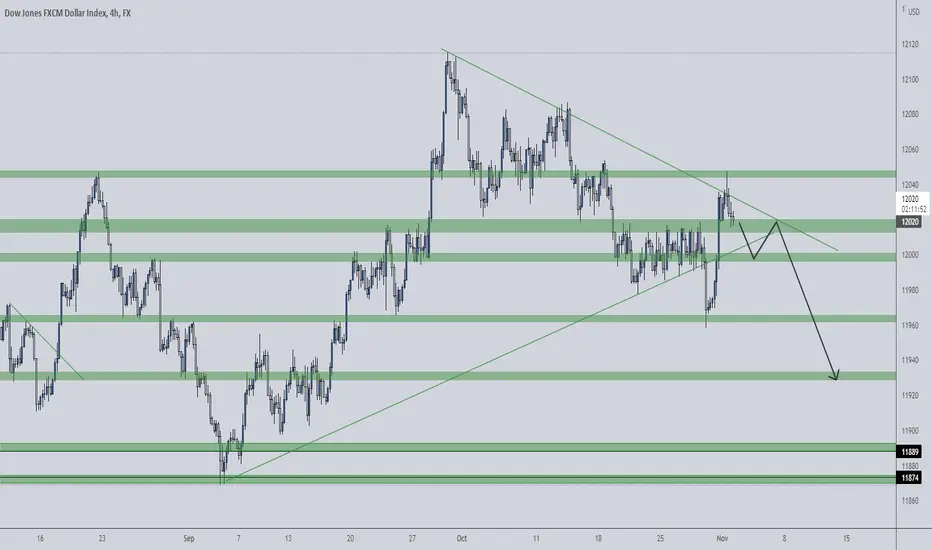
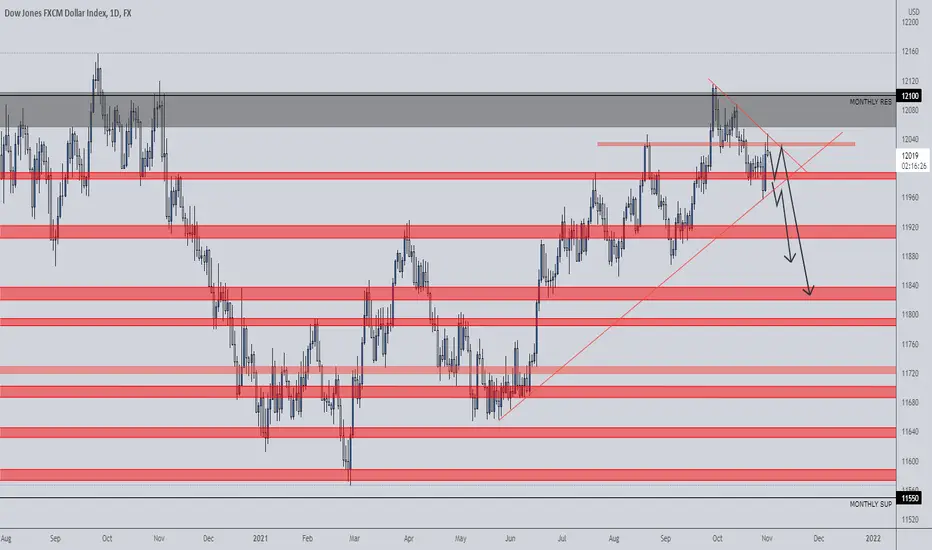
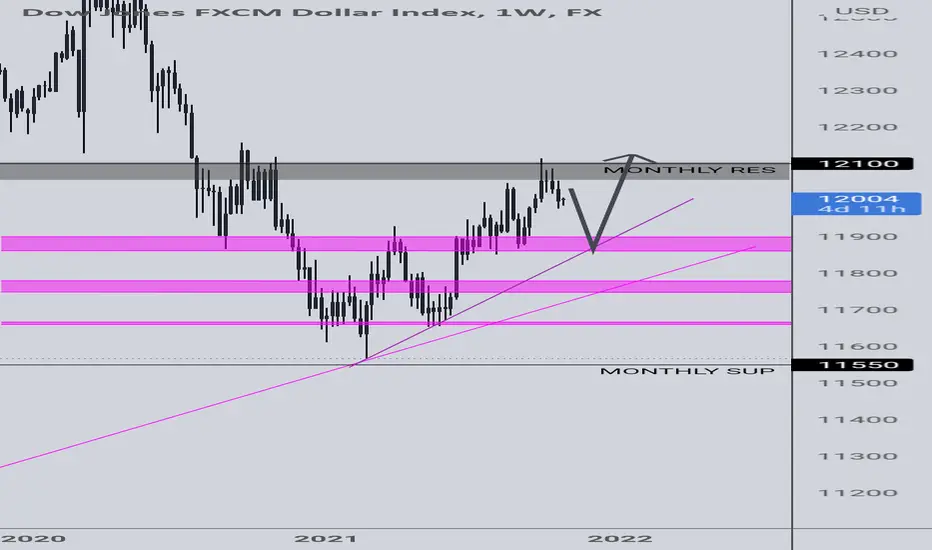
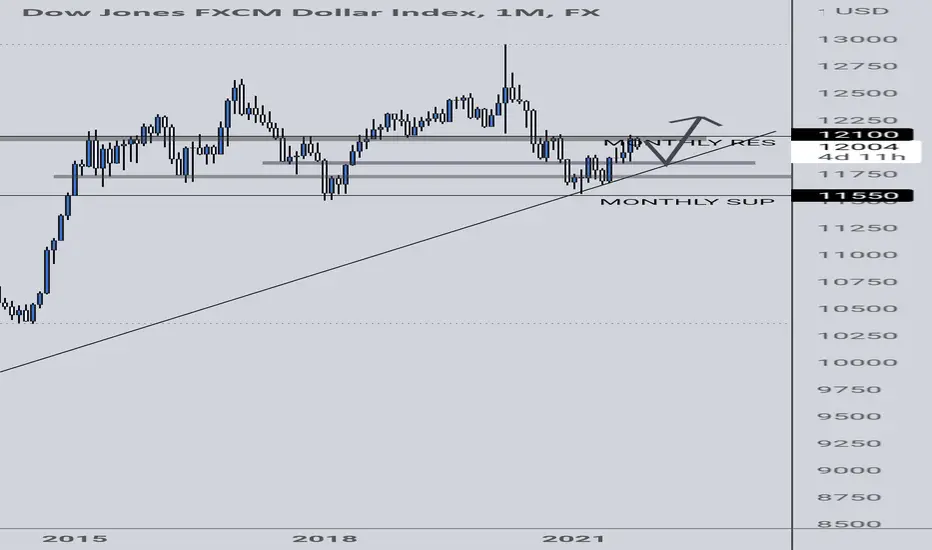
DOWN JONES DOLLAR INDEX: COULD WE SEE THE MARKET DIP?As we explained we can see a clea channel and the Dollar touched the trend resistance. Could we see the USDOLLAR lose value? What could back this up?
A delay in the economic tapering which was supposed to be released earlier but will now be pushed further as the FED has to work on fixing the risen inflation. Up 6 percent which is the highest ever. Let's see how this plays out. Like share and interact with me

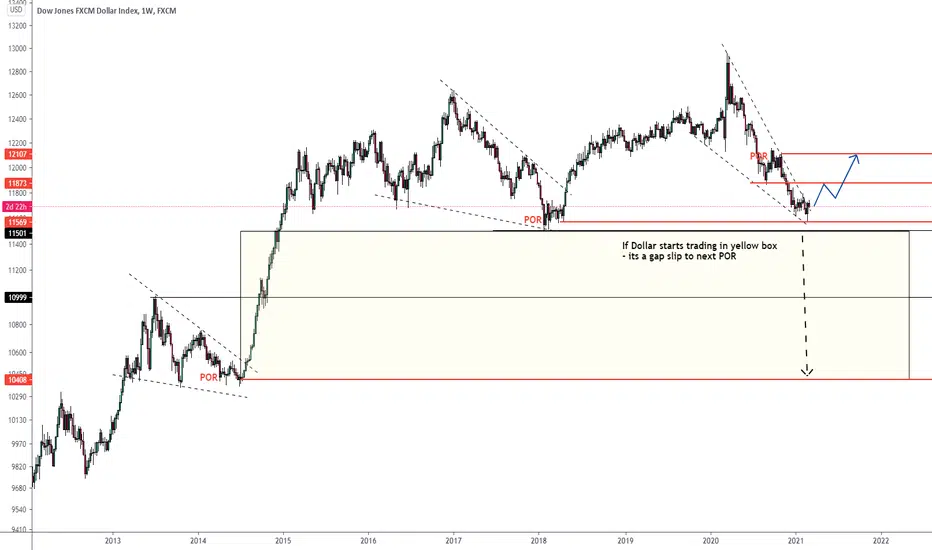
Dollar to release soonDollar is on the verge on releasing from the contracting volatility funnel.
It reacted at the previous point of release to the pip.
I suspect price to release to the upside, as uptrend is still in place (no lower low) and as you see dollar corrects itself in those contracting funnels.
If price releases to the downside (what is possible) there will be a massive gap slip. For that price needs to start trading the yellow box, below the previous low.
TIP: USDOLLAR Index is generally more accurate than DXY
For educational purposes
Fail To Win- Successful Bullish Trade DXYHere we have a successful victory on DXY. Im going for a positional trader so you see multiple colored key areas on the chart. Price was bearish coming to my broken monthly level. I wanted to see a bullish reversal once price touches it and it did. A morning star reversal pattern formed and broke above my weekly dashed line trendline. Additionally, I wanted to see price reject the broken trendline in order to prove to that it continued direction is up! Price also caught some demand from my hourly demand level. Yay, and it did. Price reversed shortly from my hourly supply level to pick up some more bullish pressure from the broken demand level. This trade went for a 1:45RR. I was amazed and so excited to see my analysis play out this way!! Perseverance and patience are vital for failures to become winners in the long run. I wish to continue the marathon which is forex.

Long term view on US Dollar indexPrice broke the buy structure on the monthly and went to take the buy-stop liquidity sitting at the resistance.
We are going to see price go to mitigate the OB or the Breaker then take the move down either buy just shooting straight for the Launchpad or by rejecting from this present weekly lower high OB and then rejecting to its lows before heading for the Launchpad

Potential Signals From The Equal Weighted DXYIn this update we review price patterns in the equal weighted DXY and the potential implications for EUR,GBP,USD & JPY

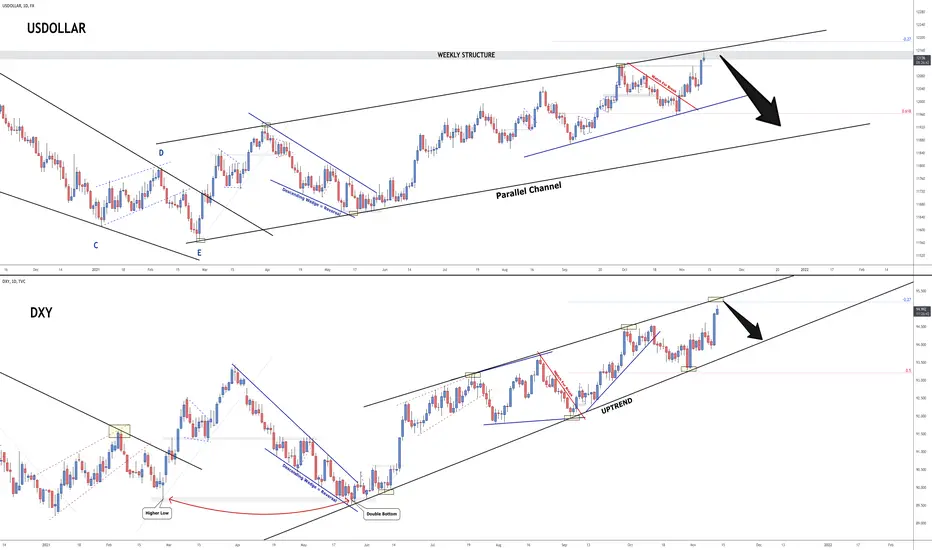
USDOLLAR x DXY - Reversal? ⚡️USDOLLAR and DXY are used to forecast USD strenth/weakness, which can be used to trade USD pairs.
In our last few analysis for USDOLLAR and DXY, we managed to forecast correctly and took advantage of it by trading USD pairs such as GBPUSD.
We are now approaching an area of interest for both USDOLLAR and DXY.
USDOLLAR:
- Approaching weekly structure
- approaching channel resistance
DXY:
- Approaching -0.27 target fibonacci
- Approaching ascending wedge resistance
Both indicating that we may see weakness from USD very soon = USDXXX short and XXXUSD long.
See below for possible USD trades.
EURUSD
GBPUSD
AUDUSD
USDJPY
If you enjoyed this, do leave a comment and like the idea for more analysis!
dollar index up trendprice is making higher high , higher low , inside a parallel channel
the last wave was started after the end of chart pattern

My Opinion on DollarThe dollar seems to stay in demand zone, my target it will go for long and find the potential supply zone on daily and weekly timeframe. So anything pair with USD, will go weak against it. eg. XXXUSD will go short if the pair stay on supply zone and USDXXX will go long if it stays on significant demand zone.

💡#i38 : US Dollar In Deep Do-Do. Great For Quality Assets⚠️🐻📉I'm Sure You've All Heard The Spiel
The US Dollar Is In Some Deep S**t
After Bottoming in Feb 2021, The Ole
Dollar Has Been Slowly Grinding To
Final Resistance On November 5th
Double Topped Out At 3649
Next Stop Notations On Charts
Detailed Variants of Idea Charts Below 🖼️🎨
FX:USDOLLAR
DJ:USDOLLAR
EIGHTCAP:USDOLLAR

DXY H4DXY has reached monthly price sensitivity zone and we would like to see some reaction in this zone
-The month ended with a bearish shooting star,highs were broken and currently we are on a HH anticipating for a HL formation
weekly
Price being in the monthly res we can see some sellers at trying to come in
daily
we can see buyers decelerating and HLs being broken
H4
Broken ascending TL and we wait
DXY DAILYDXY has reached monthly price sensitivity zone and we would like to see some reaction in this zone
-The month ended with a bearish shooting star,highs were broken and currently we are on a HH anticipating for a HL formation
weekly
Price being in the monthly res we can see some sellers at trying to come in
daily
we can see buyers decelerating and HLs being broken
DXY,WEEKLYDXY has reached monthly price sensitivity zone and we would like to see some reaction in this zone
-The month ended with a bearish shooting star,highs were broken and currently we are on a HH anticipating for a HL formation
weekly
Price being in the monthly res we can see some sellers at trying to come in

DXY MONTHLYDXY has reached monthly price sensitivity zone and we would like to see some reaction in this zone
-The month ended with a bearish shooting star,highs were broken and currently we are on a HH anticipating for a HL formation

US Dollar Rising WedgeThe dollar looks to be in a rising wedge formation (bearish set-up). The RSI is also running out of steam with lower highs. It could bull trap above the wedge before breaking down with a wick or two. It could also simply topple over soon and end up falling out the bottom trend line. Looks likely to decide by early November.
Remember, a falling dollar is good for cryptos and safe havens such as metals.

DXY,DAILYThe dollar index reached our upper monthly price sensitivity zone and we are anticipating for a slight pullback n probably continue with that bullish momentum to the upside
Daily
-from the monthly price sensitivity zone we can see Daily forming LHs ,we might see bounce of the daily descending trendline or break to the downside..

DXY,WEEKLY The dollar index reached our upper monthly price sensitivity zone and we are anticipating for a slight pullback n probably continue with that bullish momentum to the upside
DXY,MONTHLY The dollar index reached our upper monthly price sensitivity zone and we are anticipating for a slight pullback n probably continue with that bullish momentum to the upside
US Dollar IndexUsing USD Index to see where price is going on USD Pairs.
4H Triangle/Pennant. Bullish Trend Continuation.
Daily Bollinger Band Breakout. Major Move.
Weekly created a double bottom/W pattern and mirrored other side.
Expecting USD to be very strong.
Any pairs with USD at the end will be having strong Sells coming.
Any pairs with USD at the beginning will be having strong Buys coming.

USDOLLAR Dips in UptrendThe chart on the left shows the daily timeframe of FXCM’s USDOLLAR basket. It is in the bullish area between the upper red and upper blue. The right chart is the hourly timeframe. It has pulled back to the 50 retracement of the last major impulse up. The stochastic has turned positive. We are now looking to see if this will lead a golden cross in the EMAs. If this does take place, it will be regarded as bullish. However, the momentum test is denoted by whether the stochastic can make it to the 80 level and hold that position.

Dollar - Long Opportunity - 21Price break the trendline and re-test 61.8% which is also structure.
Long wi sl & tp
