VIX model trouble for the VIX into 1988. 2108 bearish theVIXthe chart is that of the 1 day vix abc rally is forming in VIX this would see the setup to under 12 PANIC CYCLE DECLINES 8 TO 13 TD . SEE XLU 13 DAYS
VOLX trade ideas

VIX just confirmed bullish trendNew support on VIX has been established in light of the recent formation of a classic bullish catapult confirmed. Will post a bullish vertical price objective soon

VIX spikes in 2018, 2020 and 2023The last 2 major vix spike events in Jan 2018 and March 2020 have followed the exact same technical pattern on all 3 metrics - VIX, RSI of VIX and MACD of VIX.
In 2022 and 2023, we are on the exact same trajectory on all 3 metrics. This indicates major vix spike in Nov 2023.
The fundamentals/reasoning behind this -
1. reducing corporate earnings,recession
2. very difficult to finance new spending by corporations
3. large gaping holes in balance sheets of financial institutions because of unrealized losses on bond positions.

Vix in spike zonethe 3 month chart of Vix shows that it spikes up when it touches this level plus October is when corrections happen according to a lot of media because of Black Monday on Oct 19, 1987. We're in for two weeks of quick drops so a lot of money can be made using short term options knowing this information. I personally had 1000 puts on SQ, but a few hundred of them expired worthless on Friday. Probably will top up a few hundred cheap puts next week.
Gold looks weaker than the SPY so I think gold miners will fall even harder.

vix and spy will try to capitulate call buyers first and than vix and spy will try to capitulate call buyers first and than Put buyers

VIX and S&P500 This is why stocks may rise now.Following yesterday's green stock market reaction, we compare on today's analysis VIX (Volatility Index) to the S&P500 (SPX) price action on the 1D time-frame. Our goal is to find clues to how the Volatility Index can affect the stocks.
As you can see, VIX is trading within an Ascending Triangle which 2 days ago got rejected on its top (Higher Highs) trend-line. All this while its Lower Highs trend-line since September 2022 (1 year back) sits right above it. At the same time the S&P500 index found the bottom (Lower Lows trend-line) of its Channel Down (while the Higher Lows trend-line since the October 2022 market bottom sits right below) and on first impression appears to be rebounding. Being negatively correlated, the more VIX drops, i.e. market volatility calms/ decreases, the more likely it is for the stock market to rise, at least for the short-term towards the Channel Down top (similarly VIX to the Triangle's Support).
In order to see it resume the long-term bullish trend, VIX most likely needs to break its Support. It is not unlikely as the market may respect the long-term Lower Highs (similarly Higher Lows for SPX) and hold it as new rejection point, but for the time being we have to keep our perspective on the short-term patterns (Ascending Triangle and Channel Down respectively) until shown otherwise.
-------------------------------------------------------------------------------
** Please LIKE 👍, FOLLOW ✅, SHARE 🙌 and COMMENT ✍ if you enjoy this idea! Also share your ideas and charts in the comments section below! **
-------------------------------------------------------------------------------
💸💸💸💸💸💸
👇 👇 👇 👇 👇 👇

V-I-X move fastwhat does it show ??
we are going to have super active market in next week.
< careful on your short positions >

vix daily trend 2020 vs 20232023 vix following the exact same pattern as it followed in late 2019- early 2020.
Tread with caution.

VIX weekly trendwhen plotted on weekly timeframe, vix forms the exact pattern match between late 2019-2020 and 2023.
I did not invent these lines, they were already there.

Buying Opportunities When the VIX JumpsInvesting or opening long positions when the TVC:VIX jumps can be a profitable strategy if done correctly, as it often signifies elevated market fear and potential undervaluation of assets.
But first, let's figure out what TVC:VIX is!
The Volatility Index, or TVC:VIX , is a real-time market index representing the market’s expectation of volatility over the next 30 days. Often referred to as the "fear gauge," a surge in the TVC:VIX usually signifies increased uncertainty, risk, and investor sentiment that the market will move sharply, either downward or upward.
So, now let’s take a look at the chart!
You probably remember how we opened a position at level 13, and now we have designated a profit zone, and now the price has come exactly to this zone and I have already closed the position, now that the TVC:VIX has grown, this creates a good opportunity to buy heavily oversold securities long.
How to find oversold securities, you can use a screener and filter out securities with RSI < 20 or were less than 20 recently. It is important to consider the quality of securities so as not to buy paper that no longer plans to grow. There are some good securities that I've already bought: NYSE:DG , NASDAQ:DLTR , WBA.
Managing Risk
Investors should consider implementing risk management strategies, such as stop-loss orders and portfolio diversification, to protect against significant losses when the VIX is high. Maintaining a well-diversified portfolio and avoiding panic selling are also essential in navigating markets during increased volatility.

V-I-X movement check marketHi !
check out vix power how it wants go
our community seems going to be scared next weeks

VIX: Minor 3To the extent we remain elevated over our most recent low, I would expect here, and through September, a rise into the 20s. in Minor Impulsive fashion. Targeting 22-24. Seems low, but based on the ES count, bulls should be "realizing" they have underestimated the Intermediate (4) and thus will need to allow for testing of support, ideally, above 4237...with what will appear to be a Minor C. Perfect, since Bears would agree, Minor Impulse, downward.

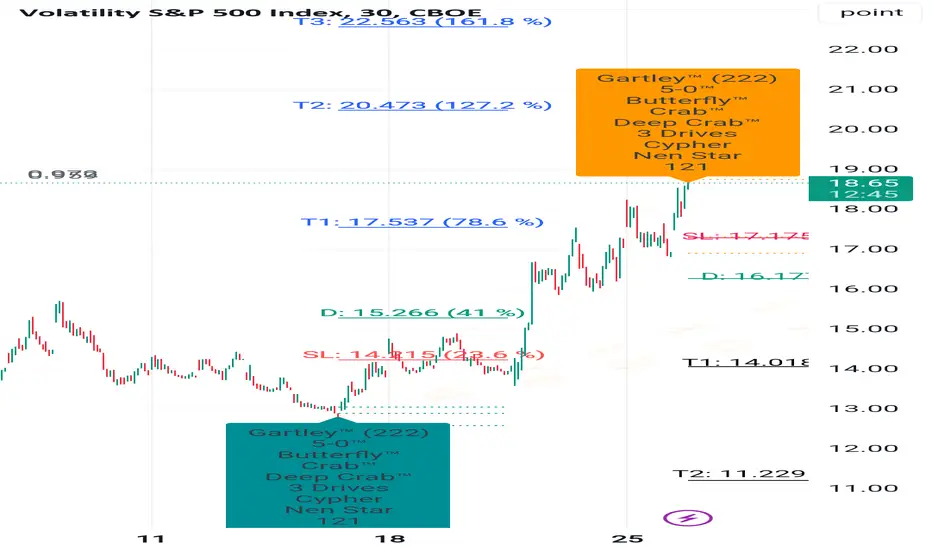
CBOE volatility index from 13 to 18 + now going up only On Our Harmonic pattern indicator based trade setup take trade as explained below :-
Early trades Buy or sell below/ above 23.6 %, safe trades buy or sell above / below 41% , after taking trade next upside or downside levels will be target ,
When reverse buy or sell signal appear then book profit on Target or trail SL to 23.6 % If trailing SL hit then early trade can be taken above or below 23.6 and safe trade can b taken above/ below 41% ..
Please note:-
It's working on news based and volitile market very well so exit if SL hit
✅VIX BEARISH SETUP|SHORT🔥
✅VIX surged again to retest the resistance of 18.8
But it is a strong key level
So I think that there is a high chance
That we will see a bearish pullback and a move down
SHORT🔥
✅Like and subscribe to never miss a new idea!✅

Buy VIX putsTop of a very consistent down channel on VIX.
Puts should print nicely here.
Use a stoploss, thanks!

VIXOff to an interesting start this week already almost back at the uptrend line. Was this breakdown since May just a false breakdown and now the real move up comes? Or is this just a retest of the breakdown before falling further? I think this week & next will be telling on the market direction for the rest of the year.

VIX Above 15 care taken to avoid danger or mistakes. 18 "resistance". possible cool 16.80. BB outside.

CBOE going high as said earlier in few days ago For all trade on my Auto Harmonic patterns indicator trade setup -
Risky trades can take trade after crossing 23.6% on either side and safe traders can take trade after 41% We can start buying when our Trailing SL hit at 23.6% with SL of recent low our Target will be 41%, 78.6% , 127.2% 161.8% and 223.6 % , when reversal pattern appears on chart we have to trail our SL if trailing SL hit exit from long trade and initiate sell trade ,

Vix looks ready to explodeThis is an analysis of the VIX and all the times that the moving average was retested on the RSI, with bullish momentum on the Vumanchu Indicator
The VIX has previously broken below the bottom resistance level, and currently has not broken the line.
The VIX tends to explode, and if it breaks this line I believe that we will have a large spike upwards.

VIXAll
RSI hit oversold territory and is trending up. We could be looking at the start of a bullish trend.
Prediction: We see it go up. Bullish.
For my educational purpose, not to be used as financial advice.

Dark Forces Beneath the Surface - VIX!Beware those who delve too deeply into the mysteries of the financial world. Forces stir therein that defy ordinary understanding.
Within the chaos of the market, distortions have been witnessed that bend rational rules. Prices warp and fluctuate in inexplicable patterns, as if subject to influences beyond normal parameters.
It seems the turmoil does not fully arise from natural randomness. Instead, disorders may be secretly choreographed from occult sources for esoteric designs. Comparisons to humanity's primal terrors and fascinations with dominance insinuate darker agendas.
Backroom machinations are implied to surreptitiously call the tune of price gyrations according to inscrutable calculations. Entities operate beneath a veil, their techniques achieving aberrations to rouse curiosity and concern.
Allusions to Nameless Powers drift in possible symbols drawn from nether regions of psyche rather than logic. Their portentous presence lurks as quiet question beneath visible movements.
Proceed with care when meddling in market mysteries left unsolved. Lest one's interest attract notice from watchers that prefer darkness' shroud over sunlight's glare. Their designs remain obscure, though such signs paint disquieting intimations of hands not wholly human steering coefficients of unease.

VIX: “BUTTERFLY” was detected in (H4)-A bullish harmonic pattern “BUTTERFLY” was detected in (H4)
-On the downside, 11.82 should be watched.
-But the probabilities are stronger on the rise.
-The ECB’s speech will perhaps “change the situation”.
-Don't forget that Volatility lives up to its name VERY well!
-Be careful and “stay covered!” » ;-)
