New Bubble ?The CAC 40 is trading near new high at 5730 after breaking a major resistance at 5650 becoming now a support, the trend is Bullish but the question is how far can we go in this new bubble ?
5800 ? or more or we will come back to 5650 ?
so my strategy is to wait for a close above 5700 to go long to target 5760 -5770
but if we close below I am neutral till the break of 5650
FCHI trade ideas


TRY ENTER SHORT AROUNT 5775-80 for 3 tp short timeshort #CAC40 at 5776 if you cant catch it,try tom around 70-80 and sell,the plan its simply to take the correction of a bearish rsi divergence + we are on monthly resistance and a bit overbought so 3 Tp like that each tp you cut 33% of your position


Short France40 Index
I expected today that the French index will go through correction after overextended buy, but seems like, this buying frenzy hasnt stopped .
Which brings me to a good trading idea, to short this double top formation and wait for it to reach its bottom 0.681 fibo retracement after overbought levels.
Open Short FRA40 5756
Tp1 5700
Tp2 5650
Tp3 5600
Tp4 5500


Cac40 - reversalCac40 won’t hit and break highest high, but stayS below resistance and reverse back this week.
Simply price action strategy with obvious trendlines.

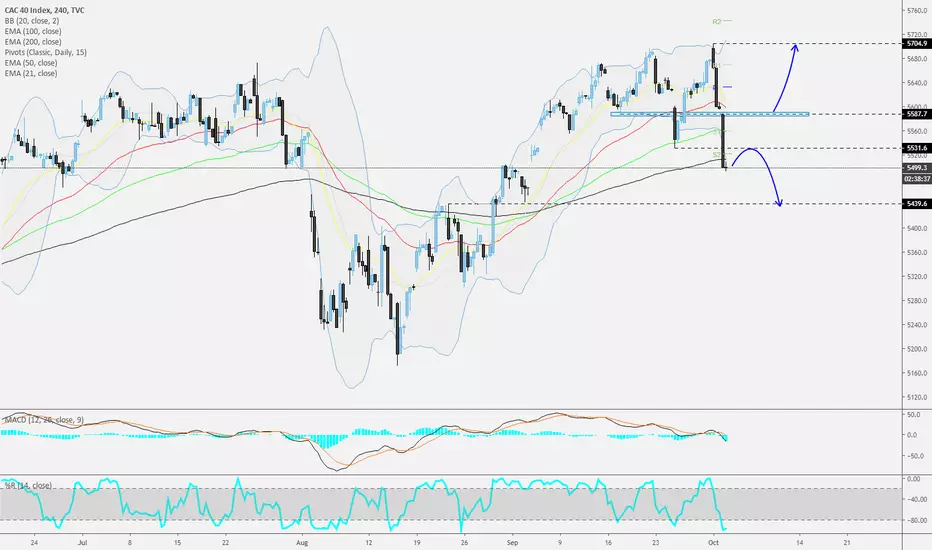
Neutral 2 sceanrio The CAC 40 is consolidating after reaching new highs at 5730 coming back under a main resistance at 5650 but the trend is still Bullish , we might continue this correction and trying to test the new support at 5539 if we manage to break the 5600 level so we have 2 scenario here :
1- the CAC 40 will test 5600 and bounce back to 5650
2- the CAC 40 will break 5600 and target 5539
so my strategy is to short now to target at least 5600


CAC40 - 240 - Correction and down again?Trade idea.
For now, the CAC40 continues to lose ground. But, given that it already quite overstretched on the shorter timeframe, there might be a chance to see a bit of correction before another leg of selling.
Please see the chart for levels and the alternative scenario.
Don't forget your stop-loss.
Selling CAC40Sharing my observations around CAC40. Given the multiple divergences observed I'd think a small short would apply here. Setting TP to the confluence point between both Fibos: current wave and the larger one.

FRA40 possible H&S formationIf 5688 is broken, h&s is invalid
At the moment It seems as if it wont break 5673.
If 5673/5688 is not broken, FRA40 is probably going to rush down to 5597 first, then consolidate to a bearish base and continue downward to around 5460~


CAC 40 NEW HIGH the CAC 40 break a major resistance at 5660-65 and trading now at 5690 making new high , I think that this push might continue and we will reach 5700-5730 soon unless some Geopolitical issue or Tweet over the trade war is made
You can go long to try target 5730 but for me I will Wait to short because the uptrend dont have very much way to go

FRA40 turning bearish.FRA40 is hitting a strong long term resistance at 5664
Turning bearish and looking to take profit at 5452 short term

Cac 40 Bear Trap ? new high or correction ?The CAC40 is on a bullish trend but show some weakness trying to break the resistance at 5660-5665 but it is so obvious that I might think that is a bear trap and we could make new high trying to reach 5700-5730 before starting a correction so for now my strategy is to wait for a better signal to short

CAC40 - Potential Breakout on Cup & HandleINDEX:CAC40
Very interesting phase in the basket that contains the first 40 French companies per market cap, or the CAC 40.
The 17-year bearish trendline was broken 2 years ago and the bearish trendline has already supported it three times and now a Cup & Handle has been formed that could break out next week and become a potential asset to enter.
