CAC40 : buy the monthly swingAs you can see in the monthly chart we have high chance to spike the tops and test 6000 zone.
Therefore i look to buy only - as long we are above 5500 .
best of luck :-)
FCHI trade ideas

Short signal possible, #CAC 40 Index Serious resistance In 5642, 3 serious attempts failed.
Stochastic Overbought.
Despite the rise of the Cac40, there are some signs (written above) of possible price correction.
Target: 5470

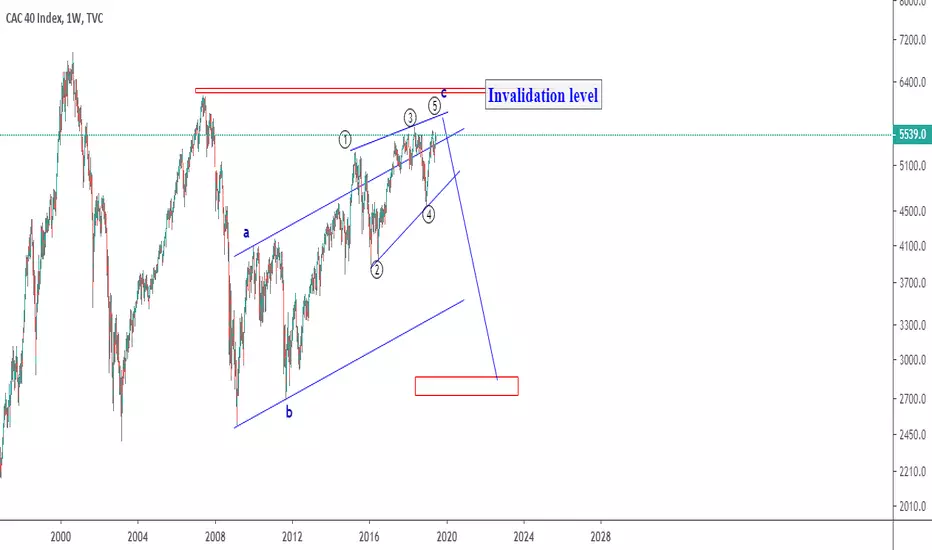
CAC40That is a very good question regarding CAC40. The price gives us a bearish signal. As the price is around the resistance level which is also around 61.8% fib lvl of the original drop. Since the trend-line established Dec 2018 broken, we can consider this rising wedge as a correction. But what if it doesn't happen as we planned? The backup plan is also included.

short 5501 and tp 5440 as last gap is filledlast gap filled ,next step back on dsupport if need an impulsion to go more up or to crash, will depend on us-china headlines


CAC 40 Trade (2-day Short Trade)Markets are volatile and with the yield curve inversion, uncertainty is heightened in the short-term we can see a lot of down and up swings making it a great opportunity to trade short-term on indices.
I chose CAC as it is less volatile compared to FTSE 100.
This is my first post.. lets see how it goes!


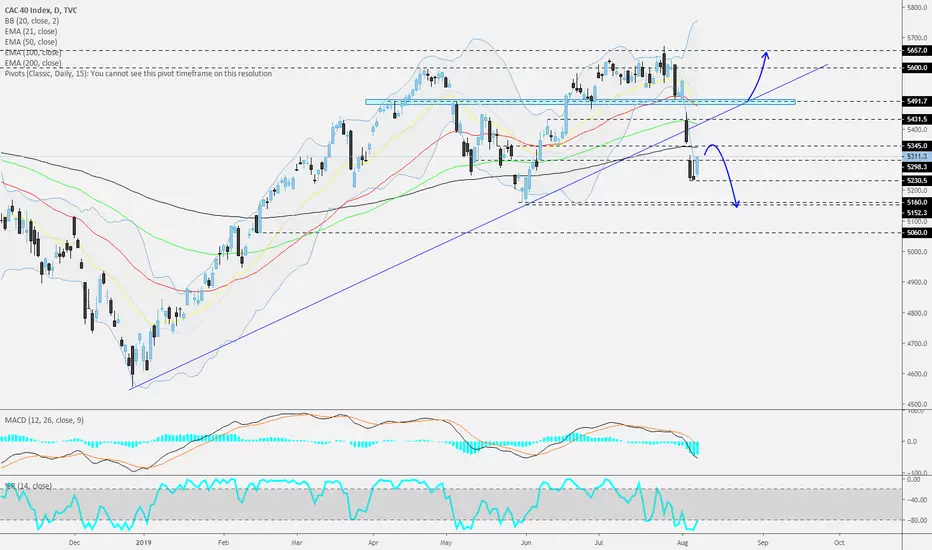
CAC40 - Daily - Below the upside lineTrade idea
For now, we are seeing a nice recovery in CAC40, after the strong sell-off that the index experienced on Monday. As long as it remains below that upside line, we will remain bearish over the short-term outlook and aim a bit lower.
Please see the chart for levels and targets.
Don't forget your stop-loss.
FRA40 - Formation of Expanding Wedge on the 4Hr ChartPrice has formed an expanding wedge formation on the 4hr chart. This Index created a New ATH on 25th July and has since been in a bearish move. We feel the price will complete a retracement to the 38% Fib level before continuing in it current direction towards the 127 Fib Extension. Bias is still Bullish, and once our current target is reached, this Index could reverse and continue in its Push Up.


CAC40 Fails to make New All Time HighsThe French CAC40 has struggled to break above the resistance zone into all time new highs. The ECB has promised cutting rates further negative and more stimulus...we shall wait to see the developments, but so far the markets have already priced that in and sold off today after the announcement.
The CAC40 on the 4 hour shows 2/3 market trends. We had an uptrend with well defined higher lows and higher highs, and now we are ranging. On the current candle, we had a fake out with the wick above, and the bears are stepping in.
Await for a break of the 5535 zone before entering a short. See how strong the candle break is and we can assess the trade when that happens.

NEED PULLBACK LOWER TO GO HIGHER* MACD - DIVERGENCE
* CONSOLIDATION RANGE
* CONTINUE UPTREND
*CREATE BULLISH FLAG PATTERN

FRA 40 (CAC40), Price is approaching to historical 13-Month HighI will open sell after fake broke of key level 5658.000:
- 5658.000 is a historical 13-Month High.
- Many retail traders set their stop losses above such historical highs. Big players hunt for such places to accumulate volume.
- Potential profit will be in 5...20 times bigger than risk.

CAC40 - Daily - Not an all-time high, but...Trade idea
CAC40 got held near its April high, at around 5600 barrier. If the index breaks above it, we may see the price moving further up, to test the 2018 high, near the 5657 zone.
This is a quick shout-out. The chart is self-explanatory. Please see the levels and targets on it.
Don't forget your stop-loss.

France40 short term buy setup BEFORE SellHi Guys the FR40 is finally completing the B wave of a bigger flat correction, I have been tracking it for a while , I am anticipating it to break the top before a reversal to the downside.
*Wait for flag then sell the breakout once the trend is broken.
Trade with care
Thank you for your support

Bearish area developing - FR40Price is stalling in significant resistance zone. Consolidation after exhaustive bull run.
Looking for a fast breakdown moving away from the entry similar to last drop from previous swing high.
OANDA:FR40EUR


CAC40, SHORT TILL 51601.Price is retracing in a downtrend
2.Trend line is nearby
3.Short if a reversal sign appears


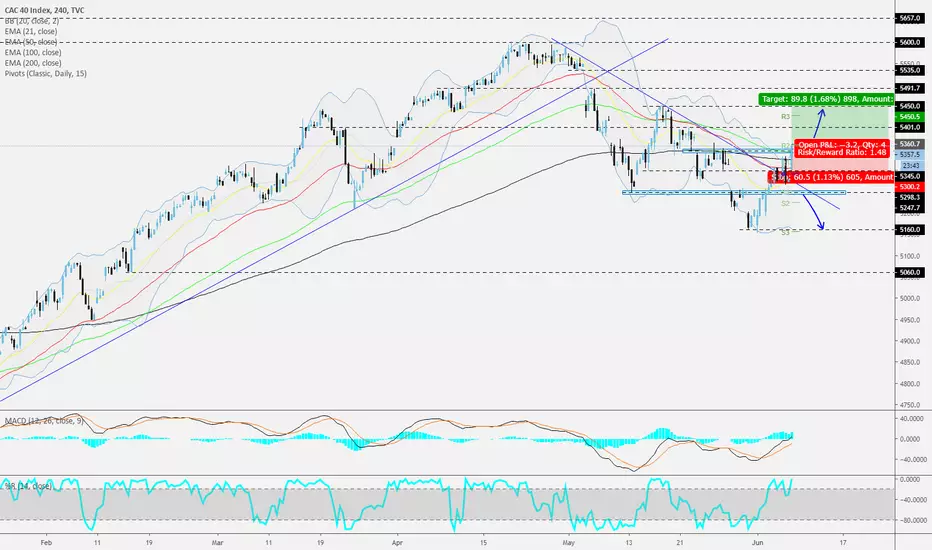
CAC40 - 240 - Quick ideaTrade Idea
This is just a quick shout-out on CAC40, which has broken the short-term downside line and also one of the key resistance barrier at 5345.
Please see the chart for levels and targets.
Don't forget your stop-loss.
CAC40 - 240 - Wait for itTrade idea.
Yesterday, the index managed to recover some of its losses and traveled higher to test the short-term tentative downside line. If that line continues to hold the rate down, then we could see another round of selling. But if it breaks and we see at least a 4-hour candle closing above it, this might increase the chances for a further push higher. That said, for a better confirmation of the upside, ideally, we would wait for a break and a close above the 5345 barrier. This way, the index would be back above the 200 EMA again, which could be seen as a positive sign.
Please see the chart for levels and target.
Don't forget your stop-loss.
